8039 W Avenue C 2 Lancaster, CA 93536
Northwest Antelope Valley NeighborhoodEstimated payment $281/month
2.5
Acres
$17,960
Price per Acre
108,900
Sq Ft Lot
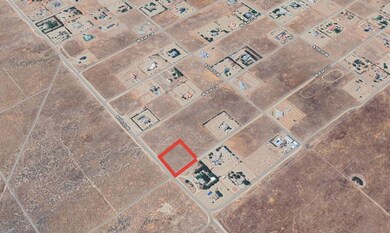
About This Lot
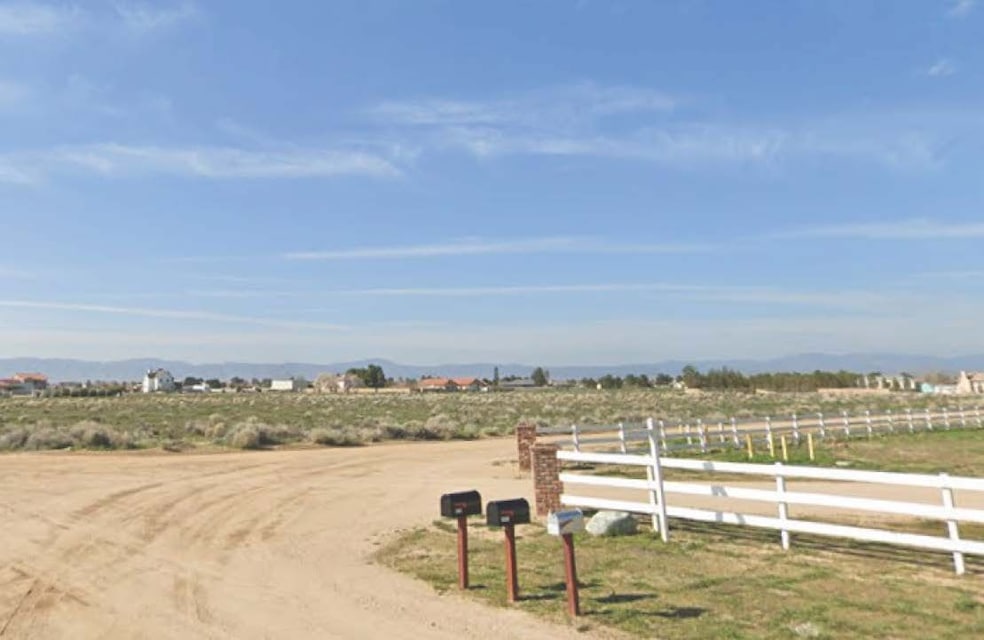
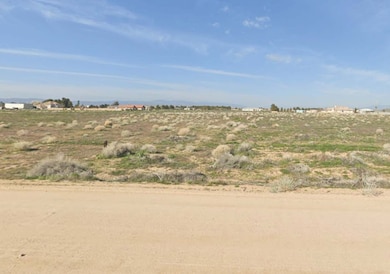
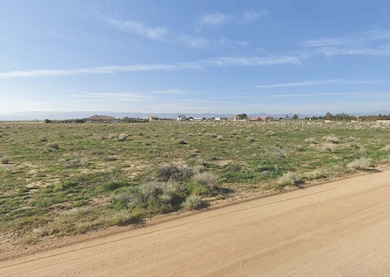
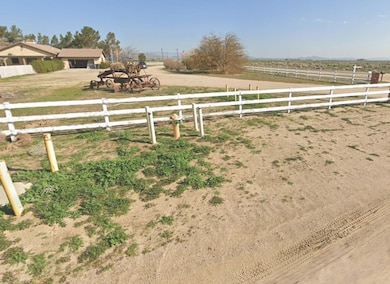
Best lot available in Antelope Acres. Priced miles below similar parcels on the market today. This is a level lot at the corner of 80th St west and C-2. There is public water fire hydrant directly across the street. Over head power is less than a block away. Rare opportunity to build your own home in a neighborhood with beautiful homes and ranches at an extremely affordable price. Public water is here so you don't have to worry about dry wells or poor water quality. Compare to the others to see what a great deal this is.
Listing Provided By

Property Details
Property Type
- Land
Est. Annual Taxes
- $3,679
Lot Details
- Dirt Road
- Corner Lot
- Potential uses include equine, residential single, hobby farm
Utilities
- Overhead Utilities
- Septic Tank
Map
Create a Home Valuation Report for This Property
The Home Valuation Report is an in-depth analysis detailing your home's value as well as a comparison with similar homes in the area
Home Values in the Area
Average Home Value in this Area
Tax History
| Year | Tax Paid | Tax Assessment Tax Assessment Total Assessment is a certain percentage of the fair market value that is determined by local assessors to be the total taxable value of land and additions on the property. | Land | Improvement |
|---|---|---|---|---|
| 2025 | $3,679 | $288,442 | $109,450 | $178,992 |
| 2024 | $3,679 | $282,787 | $107,304 | $175,483 |
| 2023 | $3,647 | $277,243 | $105,200 | $172,043 |
| 2022 | $3,582 | $271,808 | $103,138 | $168,670 |
| 2021 | $3,425 | $266,479 | $101,116 | $165,363 |
| 2019 | $3,321 | $258,577 | $98,118 | $160,459 |
| 2018 | $3,302 | $253,508 | $96,195 | $157,313 |
| 2016 | $3,087 | $243,665 | $92,460 | $151,205 |
| 2015 | $3,045 | $240,006 | $91,072 | $148,934 |
| 2014 | $3,050 | $235,306 | $89,289 | $146,017 |
Source: Public Records
Property History
| Date | Event | Price | List to Sale | Price per Sq Ft |
|---|---|---|---|---|
| 12/03/2025 12/03/25 | For Sale | $44,900 | -- | -- |
Purchase History
| Date | Type | Sale Price | Title Company |
|---|---|---|---|
| Grant Deed | $224,000 | Lsi Title Company | |
| Trustee Deed | $307,558 | National Title Ins Co If Ny | |
| Grant Deed | $550,000 | First American Title | |
| Corporate Deed | $450,000 | -- | |
| Grant Deed | -- | Equity Title | |
| Interfamily Deed Transfer | -- | Southland Title |
Source: Public Records
Mortgage History
| Date | Status | Loan Amount | Loan Type |
|---|---|---|---|
| Open | $179,200 | Purchase Money Mortgage | |
| Previous Owner | $440,000 | Purchase Money Mortgage | |
| Previous Owner | $360,000 | Stand Alone First | |
| Previous Owner | $175,000 | No Value Available | |
| Closed | $90,000 | No Value Available |
Source: Public Records
Nearby Homes
- 49945 80th St W
- 0
- 11800 Avenue B-10
- 4360 W Avenue B 8
- 8343 W Avenue c10
- 7700 W Avenue c12
- 0 Avenue B6 81st St W
- 0 C4 Vic Vac Ave Unit 25007120
- 14500 W Avenue C 14
- 0 W Ave B 8 Unit 25004587
- 49239 80th St W
- 8347 W Avenue D
- 0 Ave D Vic 81 Stw Unit 24009310
- 0 72nd St West and B10 Unit 25002036
- 0 Cor of 70th St W and Ave C Unit 22003062
- 8541 W Avenue D
- 0 Vic Avenue C4 90 Stw Unit 25005399
- 85xx W Vic Avenue B
- 1 Avenue B-6
- 0 Vic Avenue C6 90 Stw Unit 25003041
- 49239 80th St W
- 8714 W Avenue e4
- 8445 Gaskell Rd
- 45105 73rd St W
- 3080 Sedona St
- 2935 W Lancaster Blvd
- 3237 Garnet Ave
- 6212 W Pondera St
- 6036 W Ave J
- 2329 Driftwood Dr
- 5815 W Ave J 12
- 2618 Desert St Unit 11
- 4426 Jade Ct
- 4144 W Ave J 6
- 13071 Irone Ave
- 43839 58th St W
- 3172 Shelley St
- 1053 W Ave Unit J14
- 1734 W Ave H 1
- 2308 Rangeview Dr