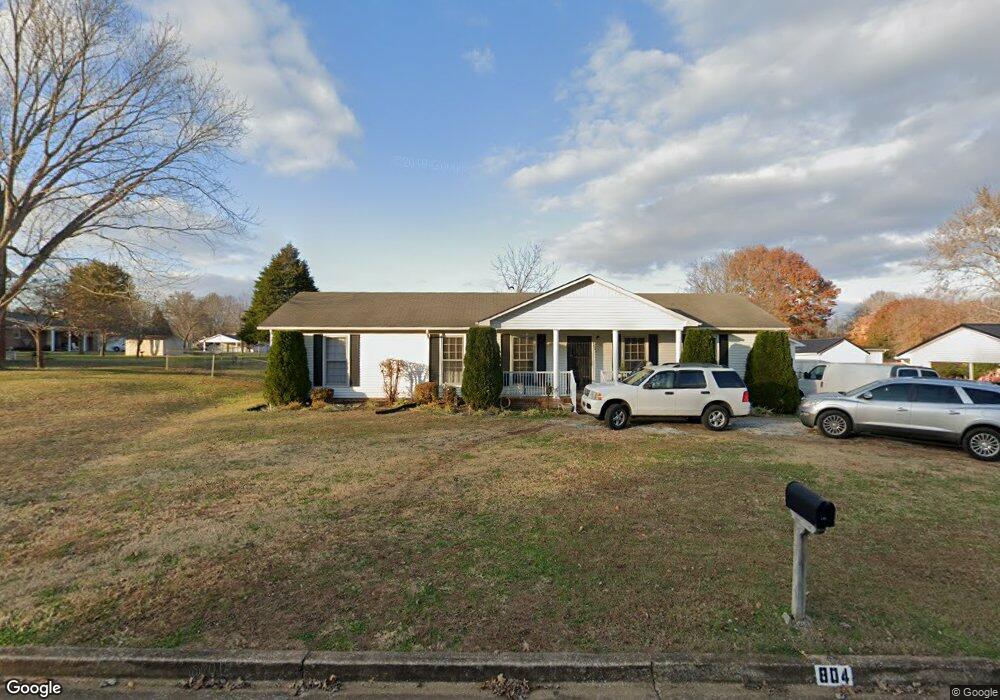
804 2nd St Lawrenceburg, TN 38464
Estimated Value: $235,756 - $302,000
--
Bed
2
Baths
1,900
Sq Ft
$144/Sq Ft
Est. Value
About This Home
This home is located at 804 2nd St, Lawrenceburg, TN 38464 and is currently estimated at $273,189, approximately $143 per square foot. 804 2nd St is a home located in Lawrence County with nearby schools including Ingram Sowell Elementary School, Lawrenceburg Public Elementary School, and David Crockett Elementary School.
Ownership History
Date
Name
Owned For
Owner Type
Purchase Details
Closed on
Nov 17, 2021
Sold by
Turner James A and Turner Linda M
Bought by
Cox Kimberly Ann and Cox Jimmy Ray
Current Estimated Value
Home Financials for this Owner
Home Financials are based on the most recent Mortgage that was taken out on this home.
Original Mortgage
$103,000
Outstanding Balance
$79,332
Interest Rate
2.23%
Mortgage Type
Purchase Money Mortgage
Estimated Equity
$193,857
Purchase Details
Closed on
Aug 28, 1993
Bought by
Smith Kimberly Ann
Purchase Details
Closed on
Jun 22, 1984
Bought by
Turner Linda M and Turner James A
Purchase Details
Closed on
Jan 1, 1983
Purchase Details
Closed on
Jan 1, 1982
Purchase Details
Closed on
Jan 1, 1981
Create a Home Valuation Report for This Property
The Home Valuation Report is an in-depth analysis detailing your home's value as well as a comparison with similar homes in the area
Home Values in the Area
Average Home Value in this Area
Purchase History
| Date | Buyer | Sale Price | Title Company |
|---|---|---|---|
| Cox Kimberly Ann | -- | None Available | |
| Smith Kimberly Ann | $62,000 | -- | |
| Turner Linda M | -- | -- | |
| -- | $36,000 | -- | |
| -- | $29,000 | -- | |
| -- | $6,000 | -- |
Source: Public Records
Mortgage History
| Date | Status | Borrower | Loan Amount |
|---|---|---|---|
| Open | Cox Kimberly Ann | $103,000 |
Source: Public Records
Tax History Compared to Growth
Tax History
| Year | Tax Paid | Tax Assessment Tax Assessment Total Assessment is a certain percentage of the fair market value that is determined by local assessors to be the total taxable value of land and additions on the property. | Land | Improvement |
|---|---|---|---|---|
| 2025 | $1,475 | $47,450 | $0 | $0 |
| 2024 | $1,475 | $47,450 | $3,750 | $43,700 |
| 2023 | $1,475 | $47,450 | $3,750 | $43,700 |
| 2022 | $1,475 | $47,450 | $3,750 | $43,700 |
| 2021 | $1,178 | $26,800 | $2,500 | $24,300 |
| 2020 | $1,178 | $26,800 | $2,500 | $24,300 |
| 2019 | $1,178 | $26,800 | $2,500 | $24,300 |
| 2018 | $1,178 | $26,800 | $2,500 | $24,300 |
| 2017 | $1,178 | $26,800 | $2,500 | $24,300 |
| 2016 | $1,178 | $26,800 | $2,500 | $24,300 |
| 2015 | $1,115 | $26,800 | $2,500 | $24,300 |
| 2014 | $1,115 | $26,800 | $2,500 | $24,300 |
Source: Public Records
Map
Nearby Homes