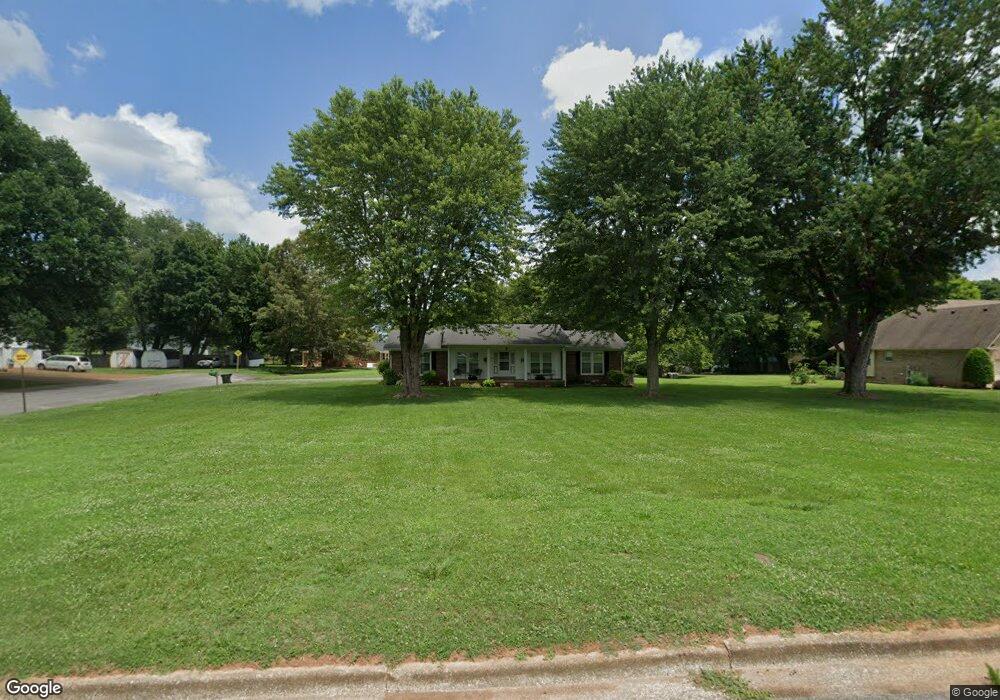
804 5th Ave Lawrenceburg, TN 38464
Estimated Value: $230,417 - $281,000
--
Bed
2
Baths
1,638
Sq Ft
$162/Sq Ft
Est. Value
About This Home
This home is located at 804 5th Ave, Lawrenceburg, TN 38464 and is currently estimated at $264,854, approximately $161 per square foot. 804 5th Ave is a home located in Lawrence County with nearby schools including Ingram Sowell Elementary School, Lawrenceburg Public Elementary School, and David Crockett Elementary School.
Ownership History
Date
Name
Owned For
Owner Type
Purchase Details
Closed on
Jan 31, 2018
Sold by
Lucy Linda
Bought by
Hyde Melvin and Hyde Margie Janet
Current Estimated Value
Home Financials for this Owner
Home Financials are based on the most recent Mortgage that was taken out on this home.
Original Mortgage
$105,000
Outstanding Balance
$59,035
Interest Rate
3.94%
Mortgage Type
Purchase Money Mortgage
Estimated Equity
$205,819
Purchase Details
Closed on
Apr 9, 2010
Sold by
Richardson Imogene
Bought by
Lucy Linda
Purchase Details
Closed on
Mar 16, 1976
Bought by
Richardson James D
Create a Home Valuation Report for This Property
The Home Valuation Report is an in-depth analysis detailing your home's value as well as a comparison with similar homes in the area
Home Values in the Area
Average Home Value in this Area
Purchase History
| Date | Buyer | Sale Price | Title Company |
|---|---|---|---|
| Hyde Melvin | $128,000 | None Available | |
| Lucy Linda | $34,236 | -- | |
| Richardson James D | -- | -- |
Source: Public Records
Mortgage History
| Date | Status | Borrower | Loan Amount |
|---|---|---|---|
| Open | Hyde Melvin | $105,000 |
Source: Public Records
Tax History Compared to Growth
Tax History
| Year | Tax Paid | Tax Assessment Tax Assessment Total Assessment is a certain percentage of the fair market value that is determined by local assessors to be the total taxable value of land and additions on the property. | Land | Improvement |
|---|---|---|---|---|
| 2025 | $1,359 | $43,725 | $0 | $0 |
| 2024 | $1,359 | $43,725 | $6,875 | $36,850 |
| 2023 | $1,359 | $43,725 | $6,875 | $36,850 |
| 2022 | $1,359 | $43,725 | $6,875 | $36,850 |
| 2021 | $1,169 | $26,600 | $4,375 | $22,225 |
| 2020 | $1,169 | $26,600 | $4,375 | $22,225 |
| 2019 | $1,169 | $26,600 | $4,375 | $22,225 |
| 2018 | $1,340 | $26,600 | $4,375 | $22,225 |
| 2017 | $1,169 | $26,600 | $4,375 | $22,225 |
| 2016 | $1,169 | $26,600 | $4,375 | $22,225 |
| 2015 | $1,107 | $26,600 | $4,375 | $22,225 |
| 2014 | $1,018 | $24,450 | $4,375 | $20,075 |
Source: Public Records
Map
Nearby Homes