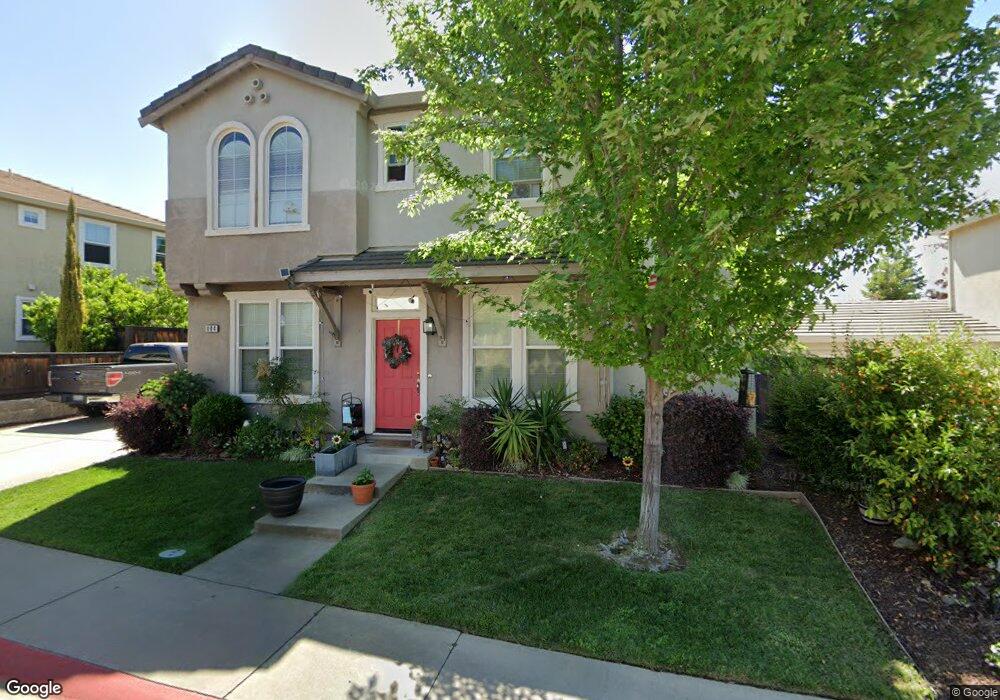
804 Bussing Ct Folsom, CA 95630
Estimated Value: $469,000 - $864,000
3
Beds
3
Baths
2,105
Sq Ft
$318/Sq Ft
Est. Value
About This Home
This home is located at 804 Bussing Ct, Folsom, CA 95630 and is currently estimated at $670,387, approximately $318 per square foot. 804 Bussing Ct is a home located in Sacramento County with nearby schools including Natoma Station Elementary School, Sutter Middle School, and Folsom High School.
Ownership History
Date
Name
Owned For
Owner Type
Purchase Details
Closed on
Jul 13, 2023
Sold by
Wagers Heather
Bought by
Wagers Heather
Current Estimated Value
Home Financials for this Owner
Home Financials are based on the most recent Mortgage that was taken out on this home.
Original Mortgage
$407,000
Outstanding Balance
$397,146
Interest Rate
6.71%
Mortgage Type
FHA
Estimated Equity
$273,241
Purchase Details
Closed on
Jan 31, 2022
Sold by
Scott Wagers
Bought by
Wagers Heather
Purchase Details
Closed on
Jun 26, 2007
Sold by
Countrywide Home Loans Inc
Bought by
Wagers Scott and Wagers Heather
Home Financials for this Owner
Home Financials are based on the most recent Mortgage that was taken out on this home.
Original Mortgage
$397,108
Interest Rate
6.36%
Mortgage Type
VA
Purchase Details
Closed on
Mar 28, 2007
Sold by
Zhigaylo Andrey A
Bought by
Countrywide Home Loans Inc
Purchase Details
Closed on
May 31, 2005
Sold by
Ryland Homes Of California Inc
Bought by
Zhigaylo Andrey A
Home Financials for this Owner
Home Financials are based on the most recent Mortgage that was taken out on this home.
Original Mortgage
$377,600
Interest Rate
5.75%
Mortgage Type
New Conventional
Create a Home Valuation Report for This Property
The Home Valuation Report is an in-depth analysis detailing your home's value as well as a comparison with similar homes in the area
Home Values in the Area
Average Home Value in this Area
Purchase History
| Date | Buyer | Sale Price | Title Company |
|---|---|---|---|
| Wagers Heather | -- | Old Republic Title Company | |
| Wagers Heather | -- | None Listed On Document | |
| Wagers Scott | $385,000 | First American Title Co | |
| Countrywide Home Loans Inc | $402,676 | Landsafe Title | |
| Zhigaylo Andrey A | $472,500 | First American Title Co |
Source: Public Records
Mortgage History
| Date | Status | Borrower | Loan Amount |
|---|---|---|---|
| Open | Wagers Heather | $407,000 | |
| Previous Owner | Wagers Scott | $397,108 | |
| Previous Owner | Zhigaylo Andrey A | $377,600 |
Source: Public Records
Tax History Compared to Growth
Tax History
| Year | Tax Paid | Tax Assessment Tax Assessment Total Assessment is a certain percentage of the fair market value that is determined by local assessors to be the total taxable value of land and additions on the property. | Land | Improvement |
|---|---|---|---|---|
| 2025 | $5,635 | $505,689 | $197,022 | $308,667 |
| 2024 | $5,635 | $495,774 | $193,159 | $302,615 |
| 2023 | $5,509 | $486,054 | $189,372 | $296,682 |
| 2022 | $5,431 | $476,524 | $185,659 | $290,865 |
| 2021 | $5,362 | $467,181 | $182,019 | $285,162 |
| 2020 | $5,298 | $462,392 | $180,153 | $282,239 |
| 2019 | $5,213 | $453,326 | $176,621 | $276,705 |
| 2018 | $5,083 | $444,438 | $173,158 | $271,280 |
| 2017 | $4,751 | $435,724 | $169,763 | $265,961 |
| 2016 | $4,940 | $427,182 | $166,435 | $260,747 |
| 2015 | $4,781 | $420,766 | $163,935 | $256,831 |
| 2014 | $4,545 | $412,525 | $160,724 | $251,801 |
Source: Public Records
Map
Nearby Homes
- 692 Humbert St
- 170 Vierra Cir
- 106 McNamee Dr
- 110 Lembi Dr
- 121 Chesterfield Way
- 705 Diamond Glen Cir
- 467 Jewel Stone Way
- 190 Oxburough Dr
- 45 Diggins Dr
- 718 Hunter Place
- 683 Loomis Cir
- 830 Duchow Way
- 901 Coloma St
- 709- Persifer St
- 151 Glenn Dr
- 810 Sibley St
- 167 Price Way
- 98-98 1/2 Dean Way
- 661 Fisher Cir
- 124 Fargo Way