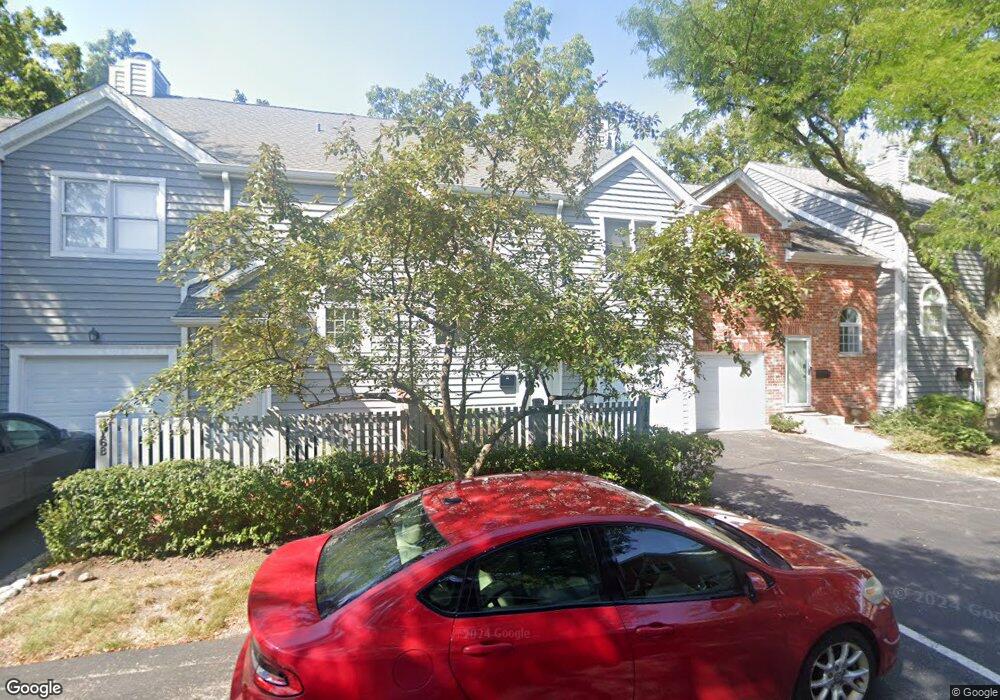
804 Chestnut St Unit 17 Deerfield, IL 60015
Estimated Value: $417,000 - $455,000
2
Beds
3
Baths
1,624
Sq Ft
$267/Sq Ft
Est. Value
About This Home
This home is located at 804 Chestnut St Unit 17, Deerfield, IL 60015 and is currently estimated at $433,827, approximately $267 per square foot. 804 Chestnut St Unit 17 is a home located in Lake County with nearby schools including Walden Elementary School, Alan B Shepard Middle School, and Deerfield High School.
Ownership History
Date
Name
Owned For
Owner Type
Purchase Details
Closed on
Dec 12, 2018
Sold by
Birtcher Robert and Birtcher Maureen
Bought by
Solomon Richard and Solomon Eileen
Current Estimated Value
Home Financials for this Owner
Home Financials are based on the most recent Mortgage that was taken out on this home.
Original Mortgage
$225,000
Outstanding Balance
$198,507
Interest Rate
4.87%
Mortgage Type
New Conventional
Estimated Equity
$235,320
Purchase Details
Closed on
Apr 29, 2016
Sold by
Pondel Gregory and Pondel Virginia
Bought by
Birtcher Robert and Birtcher Maureen
Purchase Details
Closed on
Oct 30, 2009
Sold by
Liebman Maurice and Liebman Shirley
Bought by
Pondel Gregory and Pondel Virginia
Home Financials for this Owner
Home Financials are based on the most recent Mortgage that was taken out on this home.
Original Mortgage
$231,684
Interest Rate
4.95%
Mortgage Type
FHA
Create a Home Valuation Report for This Property
The Home Valuation Report is an in-depth analysis detailing your home's value as well as a comparison with similar homes in the area
Home Values in the Area
Average Home Value in this Area
Purchase History
| Date | Buyer | Sale Price | Title Company |
|---|---|---|---|
| Solomon Richard | $300,000 | Proper Title Llc | |
| Birtcher Robert | $315,000 | Ct | |
| Pondel Gregory | $253,000 | First American |
Source: Public Records
Mortgage History
| Date | Status | Borrower | Loan Amount |
|---|---|---|---|
| Open | Solomon Richard | $225,000 | |
| Previous Owner | Pondel Gregory | $231,684 |
Source: Public Records
Tax History Compared to Growth
Tax History
| Year | Tax Paid | Tax Assessment Tax Assessment Total Assessment is a certain percentage of the fair market value that is determined by local assessors to be the total taxable value of land and additions on the property. | Land | Improvement |
|---|---|---|---|---|
| 2024 | $8,788 | $113,941 | $18,648 | $95,293 |
| 2023 | $9,068 | $109,348 | $17,896 | $91,452 |
| 2022 | $9,068 | $106,684 | $18,685 | $87,999 |
| 2021 | $8,529 | $102,858 | $18,015 | $84,843 |
| 2020 | $8,204 | $103,075 | $18,053 | $85,022 |
| 2019 | $8,024 | $102,900 | $18,022 | $84,878 |
| 2018 | $8,943 | $106,831 | $19,102 | $87,729 |
| 2017 | $8,872 | $106,490 | $19,041 | $87,449 |
| 2016 | $8,133 | $102,463 | $18,321 | $84,142 |
| 2015 | $7,952 | $96,273 | $17,214 | $79,059 |
| 2014 | $6,635 | $80,278 | $17,336 | $62,942 |
| 2012 | $6,484 | $79,570 | $17,183 | $62,387 |
Source: Public Records
Map
Nearby Homes
- 904 Forest Ave
- 745 Price Ln
- 1103 Hazel Ave
- 1009 Central Ave
- 956 Brookside Ln
- 610 Robert York Ave Unit 104
- 1038 Brookside Ln
- 934 Wayne Ave
- 1045 Fairoaks Ave
- 679 Central Ave
- 441 Elm St Unit 3A
- 630 Hermitage Dr
- 677 Timber Hill Rd
- 926 Cedar St
- 505 Margate Terrace
- 860 Kenton Rd
- 970 Ivy Ln Unit C
- 757 Kipling Place
- 312 Pine St
- 372 Kelburn Rd Unit 313
- 804 Chestnut St
- 804 Chestnut St Unit 18
- 806 Chestnut St Unit 16
- 806 Chestnut St Unit 15
- 808 Chestnut St Unit 14
- 808 Chestnut St Unit 13
- 810 Chestnut St Unit 12
- 810 Chestnut St Unit 11
- 814 Chestnut St Unit 8
- 814 Chestnut St Unit 7
- 810 Chestnut St
- 806 Chestnut St
- 804 Chestnut St Unit B
- 806 Chestnut St Unit B
- 806 Chestnut St Unit A
- 808 Chestnut St Unit B
- 808 Chestnut St Unit A
- 814 Chestnut St Unit B
- 810 Chestnut St Unit B
- 814 Chestnut St Unit A