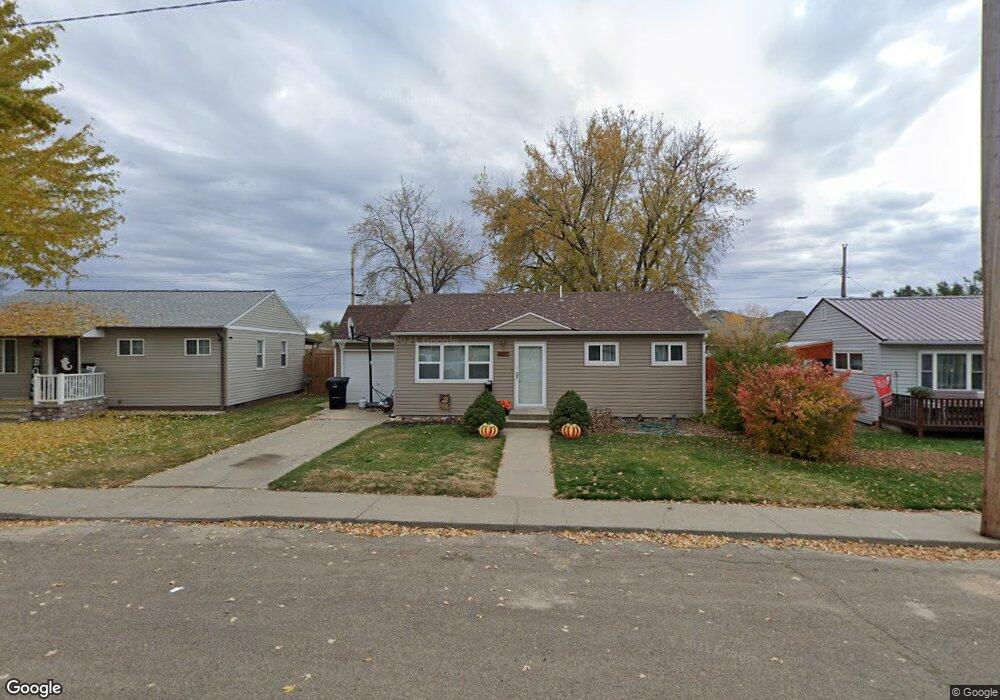
804 Dove St Glendive, MT 59330
Estimated Value: $142,000 - $165,389
2
Beds
1
Bath
1,168
Sq Ft
$131/Sq Ft
Est. Value
About This Home
This home is located at 804 Dove St, Glendive, MT 59330 and is currently estimated at $153,347, approximately $131 per square foot. 804 Dove St is a home located in Dawson County with nearby schools including Jefferson Elementary School, Lincoln School, and Washington Middle School.
Ownership History
Date
Name
Owned For
Owner Type
Purchase Details
Closed on
Aug 23, 2022
Sold by
Lange Darrell D
Bought by
Pierce Dennis T and Pierce Karen Sue
Current Estimated Value
Home Financials for this Owner
Home Financials are based on the most recent Mortgage that was taken out on this home.
Original Mortgage
$82,000
Outstanding Balance
$79,183
Interest Rate
6.9%
Mortgage Type
New Conventional
Estimated Equity
$74,164
Purchase Details
Closed on
Oct 23, 2015
Sold by
Aardahl Wesley H
Bought by
Delange Darrell
Purchase Details
Closed on
May 3, 2007
Bought by
Aardahl Leslie C and Aardahl Wesley H
Create a Home Valuation Report for This Property
The Home Valuation Report is an in-depth analysis detailing your home's value as well as a comparison with similar homes in the area
Home Values in the Area
Average Home Value in this Area
Purchase History
| Date | Buyer | Sale Price | Title Company |
|---|---|---|---|
| Pierce Dennis T | $102,500 | First American Title | |
| Delange Darrell | -- | First American Title | |
| Aardahl Leslie C | -- | -- |
Source: Public Records
Mortgage History
| Date | Status | Borrower | Loan Amount |
|---|---|---|---|
| Open | Pierce Dennis T | $82,000 |
Source: Public Records
Tax History
| Year | Tax Paid | Tax Assessment Tax Assessment Total Assessment is a certain percentage of the fair market value that is determined by local assessors to be the total taxable value of land and additions on the property. | Land | Improvement |
|---|---|---|---|---|
| 2025 | $1,189 | $146,600 | $0 | $0 |
| 2024 | $1,775 | $131,300 | $0 | $0 |
| 2023 | $1,650 | $131,300 | $0 | $0 |
| 2022 | $1,034 | $81,600 | $0 | $0 |
| 2021 | $892 | $81,600 | $0 | $0 |
| 2020 | $927 | $81,600 | $0 | $0 |
| 2019 | $969 | $81,600 | $0 | $0 |
| 2018 | $1,236 | $111,500 | $0 | $0 |
| 2017 | $1,199 | $111,500 | $0 | $0 |
| 2016 | $969 | $85,900 | $0 | $0 |
| 2015 | $1,059 | $85,900 | $0 | $0 |
| 2014 | $519 | $23,585 | $0 | $0 |
Source: Public Records
Map
Nearby Homes
- 307 N Sargent Ave
- 319 N Sargent Ave
- 711 and 713 N Oneil Ave
- 301 Little St
- 211 Georgetown Dr
- 109 2nd St
- 106 5th St
- 217 Chestnut Ave
- 2 Fairgrounds Rd
- 406 Country Club Rd
- 598 Highway 16
- 314 Oilfield Rd
- 314 Oilfield Rd
- 2100 Hwy 200
- TBD 2nd Ave SW
- 519 1st Ave NW
- 119 Nolan Ave E
- 36 Log Cabin Rd
- 10518 County Road 340
- 0 Montana 16
Your Personal Tour Guide
Ask me questions while you tour the home.