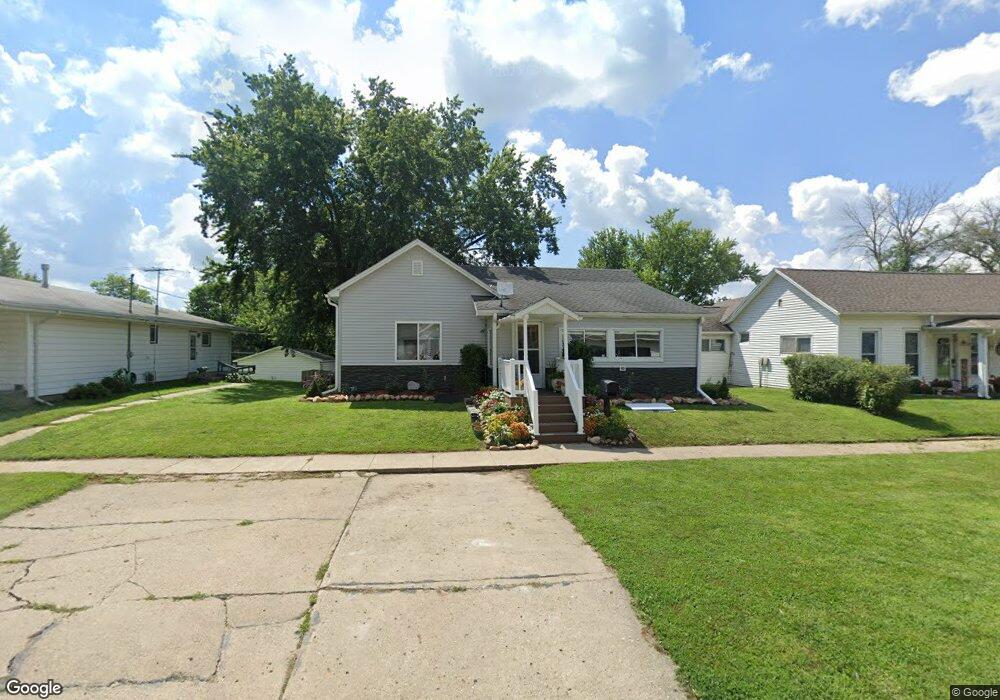
804 Eaton St Dunlap, IA 51529
Estimated Value: $107,000 - $124,702
3
Beds
1
Bath
1,376
Sq Ft
$85/Sq Ft
Est. Value
About This Home
This home is located at 804 Eaton St, Dunlap, IA 51529 and is currently estimated at $116,676, approximately $84 per square foot. 804 Eaton St is a home located in Harrison County with nearby schools including Boyer Valley Elementary School and Boyer Valley Middle/High School.
Ownership History
Date
Name
Owned For
Owner Type
Purchase Details
Closed on
Sep 21, 2022
Sold by
Smith Timothy W and Smith Ann B
Bought by
Amato Chris J and Amato Tammy A
Current Estimated Value
Purchase Details
Closed on
Sep 29, 2017
Sold by
Lampe Travis
Bought by
Smith Timothy W and Smith Ann Baldwin
Home Financials for this Owner
Home Financials are based on the most recent Mortgage that was taken out on this home.
Original Mortgage
$57,000
Interest Rate
3.82%
Mortgage Type
New Conventional
Purchase Details
Closed on
Dec 3, 2013
Sold by
Lampe Patrick E and Lampe Vickie L
Bought by
Lampe Travis
Home Financials for this Owner
Home Financials are based on the most recent Mortgage that was taken out on this home.
Original Mortgage
$60,000
Interest Rate
4.14%
Mortgage Type
Future Advance Clause Open End Mortgage
Create a Home Valuation Report for This Property
The Home Valuation Report is an in-depth analysis detailing your home's value as well as a comparison with similar homes in the area
Home Values in the Area
Average Home Value in this Area
Purchase History
| Date | Buyer | Sale Price | Title Company |
|---|---|---|---|
| Amato Chris J | $98,000 | -- | |
| Smith Timothy W | -- | None Available | |
| Lampe Travis | $53,000 | None Available |
Source: Public Records
Mortgage History
| Date | Status | Borrower | Loan Amount |
|---|---|---|---|
| Previous Owner | Smith Timothy W | $57,000 | |
| Previous Owner | Lampe Travis | $60,000 |
Source: Public Records
Tax History Compared to Growth
Tax History
| Year | Tax Paid | Tax Assessment Tax Assessment Total Assessment is a certain percentage of the fair market value that is determined by local assessors to be the total taxable value of land and additions on the property. | Land | Improvement |
|---|---|---|---|---|
| 2025 | $1,856 | $113,660 | $11,340 | $102,320 |
| 2024 | $1,856 | $103,080 | $11,340 | $91,740 |
| 2023 | $1,784 | $103,080 | $11,340 | $91,740 |
| 2022 | $1,474 | $86,050 | $11,340 | $74,710 |
| 2021 | $1,474 | $86,050 | $11,340 | $74,710 |
| 2020 | $1,300 | $73,087 | $11,340 | $61,747 |
| 2019 | $774 | $73,087 | $11,340 | $61,747 |
| 2018 | $952 | $44,466 | $0 | $0 |
| 2017 | $952 | $44,466 | $0 | $0 |
| 2016 | $966 | $44,466 | $0 | $0 |
| 2015 | $966 | $40,059 | $0 | $0 |
| 2014 | $808 | $40,059 | $0 | $0 |
Source: Public Records
Map
Nearby Homes