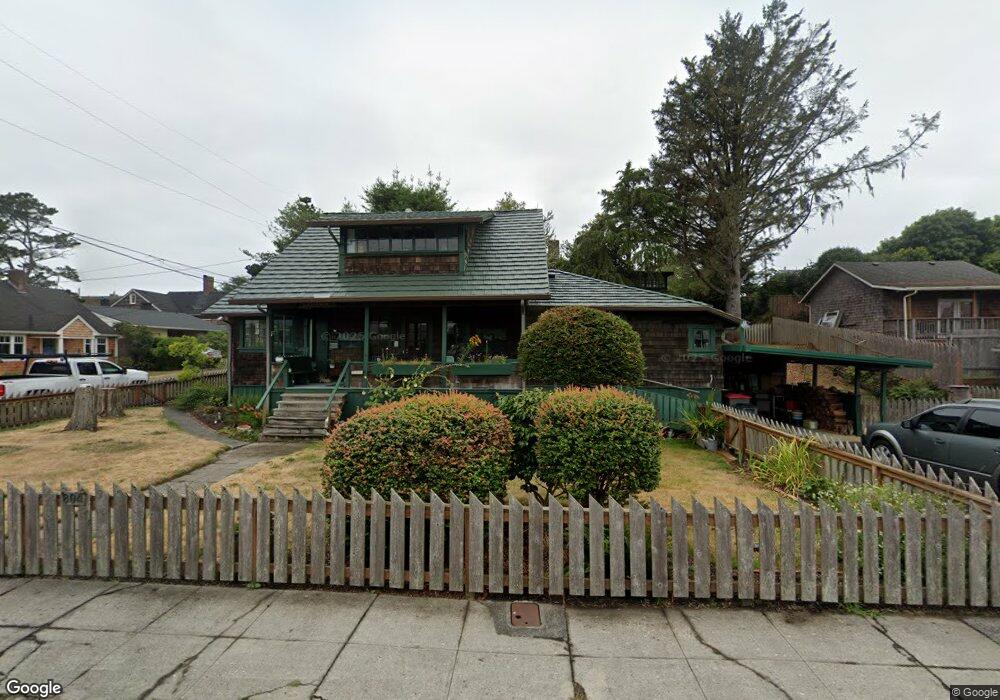
804 N Downing St Seaside, OR 97138
Estimated Value: $568,000 - $662,000
1
Bed
2
Baths
1,156
Sq Ft
$522/Sq Ft
Est. Value
About This Home
This home is located at 804 N Downing St, Seaside, OR 97138 and is currently estimated at $603,418, approximately $521 per square foot. 804 N Downing St is a home located in Clatsop County with nearby schools including Seaside High School.
Ownership History
Date
Name
Owned For
Owner Type
Purchase Details
Closed on
Apr 24, 2025
Sold by
Womack Jeffrey Lawrence
Bought by
Womack Jeffrey Scott and Womack Gladys Loraine
Current Estimated Value
Purchase Details
Closed on
Jan 24, 2020
Sold by
Womack Gladys L
Bought by
Womack Jeffrey L
Purchase Details
Closed on
Jan 23, 2007
Sold by
Womack Gregory Y
Bought by
Womack Jeffrey L and Womack Gladys L
Home Financials for this Owner
Home Financials are based on the most recent Mortgage that was taken out on this home.
Original Mortgage
$283,000
Interest Rate
1.25%
Mortgage Type
Negative Amortization
Create a Home Valuation Report for This Property
The Home Valuation Report is an in-depth analysis detailing your home's value as well as a comparison with similar homes in the area
Home Values in the Area
Average Home Value in this Area
Purchase History
| Date | Buyer | Sale Price | Title Company |
|---|---|---|---|
| Womack Jeffrey Scott | -- | None Listed On Document | |
| Womack Jeffrey L | -- | None Available | |
| Womack Jeffrey L | -- | Multiple |
Source: Public Records
Mortgage History
| Date | Status | Borrower | Loan Amount |
|---|---|---|---|
| Previous Owner | Womack Jeffrey L | $283,000 |
Source: Public Records
Tax History Compared to Growth
Tax History
| Year | Tax Paid | Tax Assessment Tax Assessment Total Assessment is a certain percentage of the fair market value that is determined by local assessors to be the total taxable value of land and additions on the property. | Land | Improvement |
|---|---|---|---|---|
| 2025 | $4,494 | $312,761 | -- | -- |
| 2024 | $4,362 | $303,653 | -- | -- |
| 2023 | $4,233 | $294,809 | $0 | $0 |
| 2022 | $4,118 | $286,223 | $0 | $0 |
| 2021 | $4,030 | $277,887 | $0 | $0 |
| 2020 | $3,936 | $269,794 | $0 | $0 |
| 2019 | $3,829 | $261,937 | $0 | $0 |
| 2018 | $3,677 | $254,309 | $0 | $0 |
| 2017 | $3,509 | $246,903 | $0 | $0 |
| 2016 | $3,087 | $239,712 | $200,539 | $39,173 |
| 2015 | $3,006 | $232,732 | $194,699 | $38,033 |
| 2014 | $2,997 | $225,955 | $0 | $0 |
| 2013 | -- | $219,375 | $0 | $0 |
Source: Public Records
Map
Nearby Homes