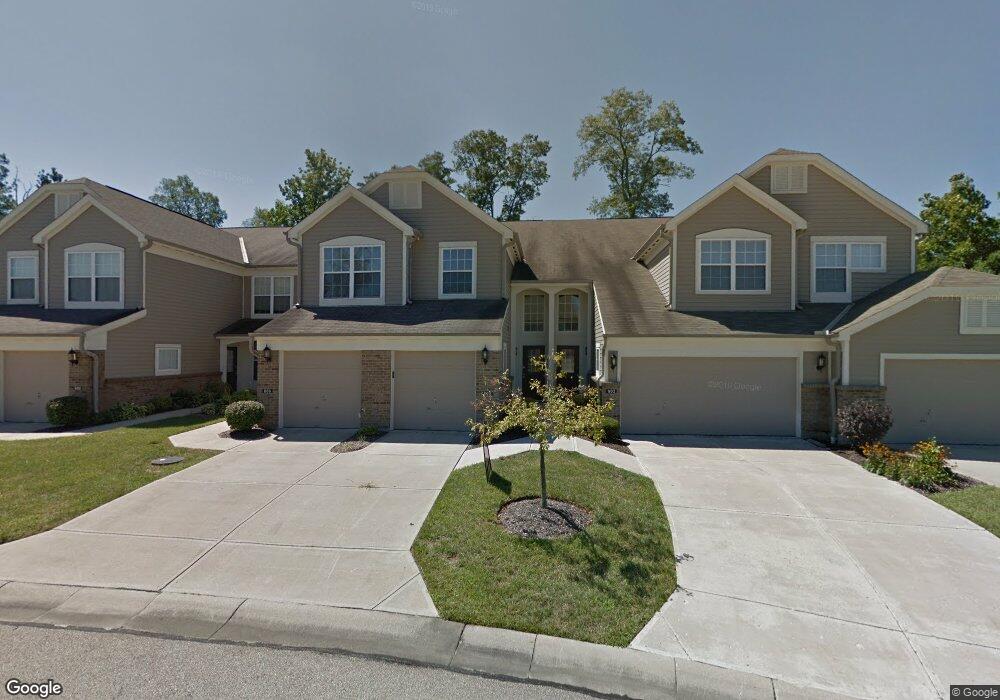
804 S Meadow Cir Unit 30303 Cincinnati, OH 45231
Finneytown NeighborhoodEstimated Value: $216,000 - $283,000
2
Beds
3
Baths
1,842
Sq Ft
$141/Sq Ft
Est. Value
About This Home
This home is located at 804 S Meadow Cir Unit 30303, Cincinnati, OH 45231 and is currently estimated at $259,830, approximately $141 per square foot. 804 S Meadow Cir Unit 30303 is a home located in Hamilton County with nearby schools including Finneytown Elementary School, Finneytown Secondary Campus, and St. Vivian School.
Ownership History
Date
Name
Owned For
Owner Type
Purchase Details
Closed on
Aug 24, 2018
Sold by
Zanoni Mark and Zanoni Ruth
Bought by
Mesmer Mantai
Current Estimated Value
Purchase Details
Closed on
Aug 31, 2011
Sold by
Citi Corp Trust Bank
Bought by
Zanoni Mark and Zanoni Ruth
Home Financials for this Owner
Home Financials are based on the most recent Mortgage that was taken out on this home.
Original Mortgage
$66,960
Interest Rate
4.12%
Mortgage Type
New Conventional
Purchase Details
Closed on
Apr 22, 2011
Sold by
Quinn Benita L
Bought by
Citi Corp Trust Bank
Purchase Details
Closed on
Dec 20, 2000
Sold by
Fischer Attached Homes Ltd
Bought by
Quinn Benita L
Home Financials for this Owner
Home Financials are based on the most recent Mortgage that was taken out on this home.
Original Mortgage
$140,600
Interest Rate
7.77%
Create a Home Valuation Report for This Property
The Home Valuation Report is an in-depth analysis detailing your home's value as well as a comparison with similar homes in the area
Home Values in the Area
Average Home Value in this Area
Purchase History
| Date | Buyer | Sale Price | Title Company |
|---|---|---|---|
| Mesmer Mantai | $130,000 | None Available | |
| Zanoni Mark | $83,700 | Prism Title & Closing Servic | |
| Citi Corp Trust Bank | $88,000 | None Available | |
| Quinn Benita L | $156,300 | Homestead Title Agency Inc |
Source: Public Records
Mortgage History
| Date | Status | Borrower | Loan Amount |
|---|---|---|---|
| Previous Owner | Zanoni Mark | $66,960 | |
| Previous Owner | Quinn Benita L | $140,600 |
Source: Public Records
Tax History Compared to Growth
Tax History
| Year | Tax Paid | Tax Assessment Tax Assessment Total Assessment is a certain percentage of the fair market value that is determined by local assessors to be the total taxable value of land and additions on the property. | Land | Improvement |
|---|---|---|---|---|
| 2024 | $4,377 | $64,309 | $8,960 | $55,349 |
| 2023 | $4,304 | $64,309 | $8,960 | $55,349 |
| 2022 | $3,890 | $42,161 | $6,832 | $35,329 |
| 2021 | $3,816 | $42,161 | $6,832 | $35,329 |
| 2020 | $3,878 | $42,161 | $6,832 | $35,329 |
| 2019 | $3,998 | $40,117 | $5,600 | $34,517 |
| 2018 | $3,690 | $40,117 | $5,600 | $34,517 |
| 2017 | $3,516 | $40,117 | $5,600 | $34,517 |
| 2016 | $2,428 | $27,195 | $4,368 | $22,827 |
| 2015 | $2,437 | $27,195 | $4,368 | $22,827 |
| 2014 | $2,445 | $27,195 | $4,368 | $22,827 |
| 2013 | $4,460 | $51,345 | $5,600 | $45,745 |
Source: Public Records
Map
Nearby Homes
- 801 Southmeadow Cir
- 810 Southmeadow Cir
- 869 Southmeadow Cir Unit 40203
- 840 Southmeadow Cir
- 685 Bridle Path
- 715 Castlegate Ln
- 7865 Ramble View
- 6837 Warder Dr
- 7423 View Place Dr
- 557 W North Bend Rd
- 517 Wellesley Ave
- 939 Timber Trail
- 7113 Greenfringe Ln
- 961 W Galbraith Rd
- 8405 Arundel Ct
- 654 Doepke Ln
- 984 W Galbraith Rd
- 966 W North Bend Rd
- 1025 Eastgate Dr
- 8608 Long Ln
- 808 S Meadow Cir Unit 30202
- 808 S Meadow Cir Unit 30G4
- 804 S Meadow Cir Unit 30303
- 804 S Meadow Cir
- 806 S Meadow Cir Unit 30203
- 806 S Meadow Cir Unit 30203
- 806 S Meadow Cir
- 812 S Meadow Cir Unit 30301
- 812 S Meadow Cir Unit 30301
- 812 S Meadow Cir
- 814 S Meadow Cir Unit 30201
- 814 S Meadow Cir Unit 30201
- 814 S Meadow Cir
- 811 S Meadow Cir
- 811 Southmeadow Cir Unit 204
- 801 Southmeadow Cir Unit 102
- 811 Southmeadow Cir Unit 38305
- 801 Southmeadow Cir Unit 38201
- 811 Southmeadow Cir Unit 38103
- 801 Southmeadow Cir Unit 38101