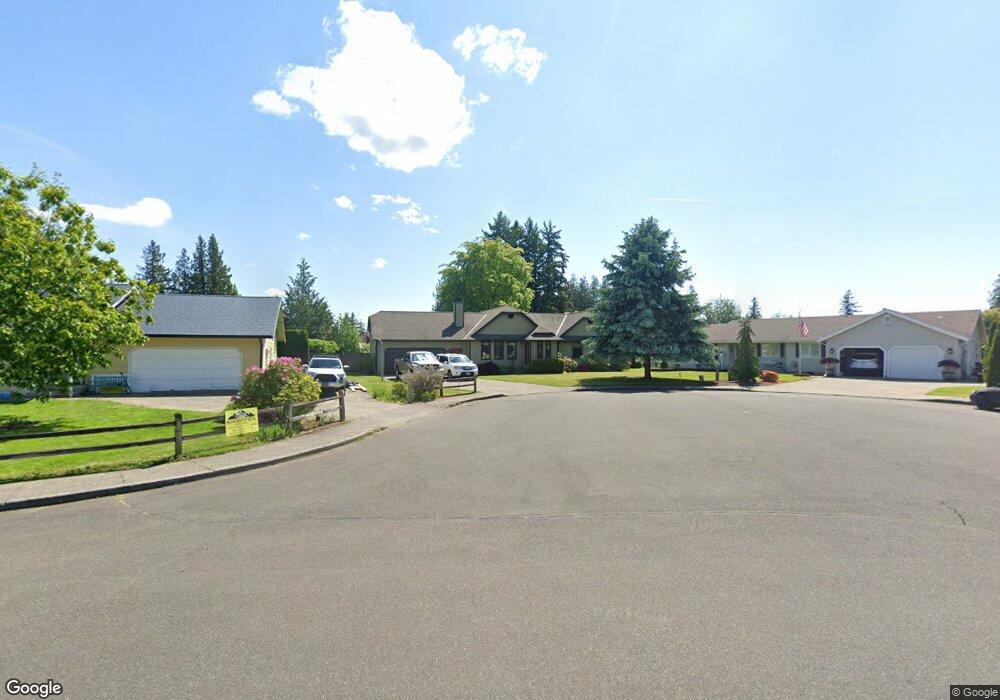
804 Vine Cir Lynden, WA 98264
Estimated Value: $677,000 - $751,000
3
Beds
3
Baths
2,468
Sq Ft
$288/Sq Ft
Est. Value
About This Home
This home is located at 804 Vine Cir, Lynden, WA 98264 and is currently estimated at $711,884, approximately $288 per square foot. 804 Vine Cir is a home located in Whatcom County with nearby schools including Lynden High School, Lynden Christian Schools: Administration, and Lynden Christian School.
Ownership History
Date
Name
Owned For
Owner Type
Purchase Details
Closed on
Mar 11, 2009
Sold by
Teel Chuck and Teel Barbara
Bought by
Wolf Christopher and Wolf Genevieve
Current Estimated Value
Home Financials for this Owner
Home Financials are based on the most recent Mortgage that was taken out on this home.
Original Mortgage
$145,000
Outstanding Balance
$90,515
Interest Rate
5.03%
Mortgage Type
Purchase Money Mortgage
Estimated Equity
$621,369
Purchase Details
Closed on
Dec 19, 2007
Sold by
Dalessandro Paul and Dalessandro Sandra L
Bought by
Teel Chuck and Teel Barbara
Purchase Details
Closed on
Aug 16, 2002
Sold by
Unema Barry P and Unema Colleen J
Bought by
Dalessandro Paul and Dalessandro Sandra L
Home Financials for this Owner
Home Financials are based on the most recent Mortgage that was taken out on this home.
Original Mortgage
$185,250
Interest Rate
6.51%
Create a Home Valuation Report for This Property
The Home Valuation Report is an in-depth analysis detailing your home's value as well as a comparison with similar homes in the area
Home Values in the Area
Average Home Value in this Area
Purchase History
| Date | Buyer | Sale Price | Title Company |
|---|---|---|---|
| Wolf Christopher | $325,280 | Chicago Title Insurance Co | |
| Teel Chuck | $355,280 | Chicago Title Insurance | |
| Dalessandro Paul | $195,000 | -- |
Source: Public Records
Mortgage History
| Date | Status | Borrower | Loan Amount |
|---|---|---|---|
| Open | Wolf Christopher | $145,000 | |
| Previous Owner | Dalessandro Paul | $185,250 |
Source: Public Records
Tax History
| Year | Tax Paid | Tax Assessment Tax Assessment Total Assessment is a certain percentage of the fair market value that is determined by local assessors to be the total taxable value of land and additions on the property. | Land | Improvement |
|---|---|---|---|---|
| 2025 | $5,440 | $737,352 | $300,108 | $437,244 |
| 2024 | $5,092 | $717,517 | $266,750 | $450,767 |
| 2023 | $5,092 | $708,430 | $275,000 | $433,430 |
| 2022 | $4,251 | $557,767 | $153,434 | $404,333 |
| 2021 | $4,170 | $460,959 | $126,803 | $334,156 |
| 2020 | $3,653 | $411,581 | $113,220 | $298,361 |
| 2019 | $3,250 | $377,453 | $103,955 | $273,498 |
| 2018 | $3,552 | $344,252 | $94,699 | $249,553 |
| 2017 | $3,075 | $308,995 | $85,000 | $223,995 |
| 2016 | $2,901 | $284,463 | $82,500 | $201,963 |
| 2015 | $2,572 | $266,906 | $79,350 | $187,556 |
| 2014 | -- | $0 | $0 | $0 |
| 2013 | -- | $0 | $0 | $0 |
Source: Public Records
Map
Nearby Homes
- 924 E Grover St
- 701 E Grover St
- 1095 Terrace Dr
- 851 Garden Dr
- 8620 Bender Rd
- 1178 E Grover St Unit 101
- 211 Maple St
- 215 E Front St
- 214 E Grover St
- 212 E Grover St
- 137 E Cedar Dr
- 0 Bender Rd
- 107 Springview Dr
- 167 Cambridge Dr
- 301 S Park St
- 303 Parkside Ct
- 208 Skipping Stone Loop
- 807 E Maberry Dr
- 214 Skipping Stone Loop
- 204 Skipping Stone Loop
Your Personal Tour Guide
Ask me questions while you tour the home.