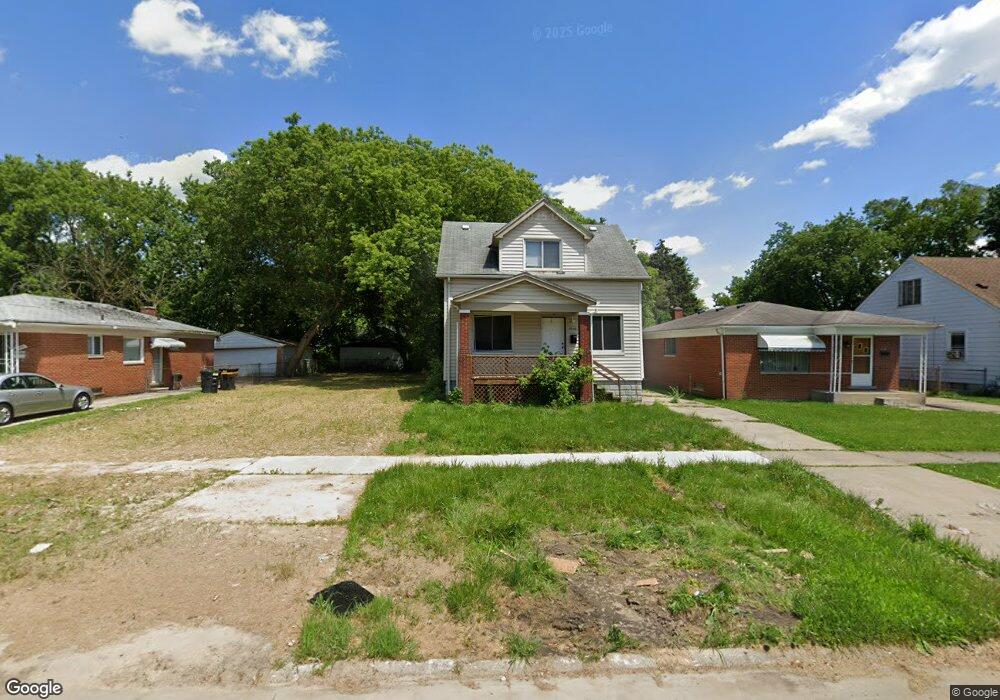
8040 Stahelin Ave Detroit, MI 48228
Franklin Park NeighborhoodEstimated Value: $42,000 - $75,039
--
Bed
1
Bath
1,026
Sq Ft
$64/Sq Ft
Est. Value
About This Home
This home is located at 8040 Stahelin Ave, Detroit, MI 48228 and is currently estimated at $66,010, approximately $64 per square foot. 8040 Stahelin Ave is a home located in Wayne County with nearby schools including Bates Academy, Charles L. Spain Elementary-Middle School, and Edward 'Duke' Ellington Conservatory of Music and Art.
Ownership History
Date
Name
Owned For
Owner Type
Purchase Details
Closed on
Aug 3, 2020
Sold by
D L J Properties Llc
Bought by
Dai Sky Investment Group
Current Estimated Value
Purchase Details
Closed on
Aug 15, 2014
Sold by
D L J Properties Llc
Bought by
Hu Wen
Purchase Details
Closed on
Aug 4, 2014
Sold by
Jaymin Llc
Bought by
D L J Properties Llc
Purchase Details
Closed on
May 2, 2013
Sold by
Gordon Kimberly
Bought by
Jaymin Llc
Purchase Details
Closed on
May 1, 2013
Sold by
Asbury Park Proerties Llc
Bought by
Gordon Kimberly
Purchase Details
Closed on
Nov 16, 2012
Sold by
Wayne County Treasurer
Bought by
Asbury Park Properties Llc
Purchase Details
Closed on
Dec 14, 2004
Sold by
Clay Kinnard
Bought by
Clay Kinnard
Purchase Details
Closed on
Jan 9, 2003
Sold by
Alexander Miriam
Bought by
Citicorp Bank Trust
Purchase Details
Closed on
Jul 27, 1994
Sold by
Ounanian Darryl
Bought by
Miriam Alexander
Create a Home Valuation Report for This Property
The Home Valuation Report is an in-depth analysis detailing your home's value as well as a comparison with similar homes in the area
Home Values in the Area
Average Home Value in this Area
Purchase History
| Date | Buyer | Sale Price | Title Company |
|---|---|---|---|
| Dai Sky Investment Group | $12,500 | None Available | |
| Hu Wen | $27,000 | None Available | |
| D L J Properties Llc | $20,000 | None Available | |
| Jaymin Llc | -- | None Available | |
| Gordon Kimberly | -- | None Available | |
| Asbury Park Properties Llc | $500 | None Available | |
| Clay Kinnard | -- | -- | |
| Citicorp Bank Trust | $52,800 | -- | |
| Miriam Alexander | $8,884 | -- |
Source: Public Records
Tax History Compared to Growth
Tax History
| Year | Tax Paid | Tax Assessment Tax Assessment Total Assessment is a certain percentage of the fair market value that is determined by local assessors to be the total taxable value of land and additions on the property. | Land | Improvement |
|---|---|---|---|---|
| 2025 | $755 | $31,900 | $0 | $0 |
| 2024 | $755 | $26,800 | $0 | $0 |
| 2023 | $731 | $20,900 | $0 | $0 |
| 2022 | $771 | $15,700 | $0 | $0 |
| 2021 | $754 | $11,900 | $0 | $0 |
| 2020 | $698 | $11,100 | $0 | $0 |
| 2019 | $744 | $9,700 | $0 | $0 |
| 2018 | $668 | $9,400 | $0 | $0 |
| 2017 | $103 | $9,600 | $0 | $0 |
| 2016 | $720 | $5,700 | $0 | $0 |
| 2015 | $570 | $5,700 | $0 | $0 |
| 2013 | $1,637 | $16,367 | $0 | $0 |
| 2010 | -- | $23,996 | $780 | $23,216 |
Source: Public Records
Map
Nearby Homes
- 8013 Stahelin Ave
- 8093 Greenview Ave
- 8203 Brace St
- 7834 Faust Ave
- 7716 Artesian St
- 8111 Warwick St
- 7795 Penrod St
- 19138 Tireman Ave
- 8080 Penrod St
- 7716 Piedmont St
- 8209 Rosemont Ave
- 7683 Warwick St
- 18940 Sawyer St
- 8451 Greenview Ave
- 8062 Grandville Ave
- 7661 Penrod St
- 8051 Ashton Ave
- 7666 Penrod St
- 8047 Grandville Ave
- 7650 Penrod St
- 8034 Stahelin Ave
- 8048 Stahelin Ave
- 8056 Stahelin Ave
- 8026 Stahelin Ave
- 8062 Stahelin Ave
- 8045 Brace St
- 8037 Brace St
- 8012 Stahelin Ave
- 8053 Brace St
- 8027 Brace St
- 8063 Brace St
- 18720 Tireman St
- 8077 Brace St
- 8071 Brace St
- 8076 Stahelin Ave
- 8002 Stahelin Ave
- 18710 Tireman St
- 8035 Stahelin Ave
- 18700 Tireman St
- 8053 Stahelin Ave