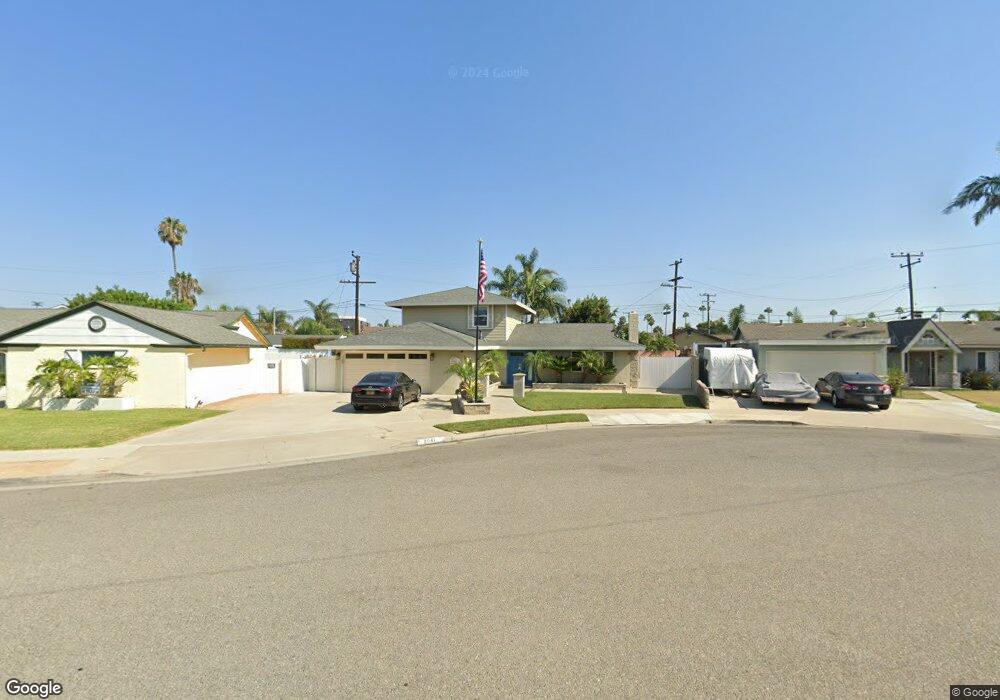
8041 Sail Cir Huntington Beach, CA 92646
Southeast NeighborhoodEstimated Value: $1,377,446 - $1,561,000
4
Beds
2
Baths
1,700
Sq Ft
$864/Sq Ft
Est. Value
About This Home
This home is located at 8041 Sail Cir, Huntington Beach, CA 92646 and is currently estimated at $1,469,362, approximately $864 per square foot. 8041 Sail Cir is a home located in Orange County with nearby schools including John R. Peterson Elementary, Isaac L. Sowers Middle School, and Edison High School.
Ownership History
Date
Name
Owned For
Owner Type
Purchase Details
Closed on
Feb 2, 2017
Sold by
Griner Irene L
Bought by
Griner Irene L and Irene L Griner Living Trust
Current Estimated Value
Purchase Details
Closed on
Jan 5, 2015
Sold by
Griner Alizabeth Arciniaga
Bought by
Griner Eliot S
Purchase Details
Closed on
Nov 22, 2002
Sold by
Griner Eliot S
Bought by
Griner Irene L
Create a Home Valuation Report for This Property
The Home Valuation Report is an in-depth analysis detailing your home's value as well as a comparison with similar homes in the area
Home Values in the Area
Average Home Value in this Area
Purchase History
| Date | Buyer | Sale Price | Title Company |
|---|---|---|---|
| Griner Irene L | -- | None Available | |
| Griner Irene L | -- | None Available | |
| Griner Mitchell W | -- | None Available | |
| Griner Eliot S | -- | Accommodation | |
| Griner Irene L | -- | -- |
Source: Public Records
Tax History Compared to Growth
Tax History
| Year | Tax Paid | Tax Assessment Tax Assessment Total Assessment is a certain percentage of the fair market value that is determined by local assessors to be the total taxable value of land and additions on the property. | Land | Improvement |
|---|---|---|---|---|
| 2025 | $1,280 | $82,201 | $33,645 | $48,556 |
| 2024 | $1,280 | $80,590 | $32,986 | $47,604 |
| 2023 | $1,248 | $79,010 | $32,339 | $46,671 |
| 2022 | $1,214 | $77,461 | $31,705 | $45,756 |
| 2021 | $1,193 | $75,943 | $31,084 | $44,859 |
| 2020 | $1,184 | $75,165 | $30,765 | $44,400 |
| 2019 | $1,174 | $73,692 | $30,162 | $43,530 |
| 2018 | $1,157 | $72,248 | $29,571 | $42,677 |
| 2017 | $1,142 | $70,832 | $28,991 | $41,841 |
| 2016 | $1,101 | $69,444 | $28,423 | $41,021 |
| 2015 | $1,089 | $68,401 | $27,996 | $40,405 |
| 2014 | $1,066 | $67,062 | $27,448 | $39,614 |
Source: Public Records
Map
Nearby Homes
- 20701 Beach Blvd Unit 103
- 20701 Beach Blvd Unit 65
- 20701 Beach Blvd Unit 100
- 20701 Beach Blvd Unit 107
- 20701 Beach Blvd Unit 298
- 20701 Beach Blvd Unit 128
- 20701 Beach Blvd Unit 200
- 20701 Beach Blvd Unit 30
- 20401 Somerville Ln
- 8202 Mary Cir
- 632 Indianapolis Ave
- 613 Frankfort Ave
- 20371 Bluffside Cir Unit B214
- 1015 Georgia St
- 20331 Bluffside Cir Unit 411
- 20331 Bluffside Cir Unit A108
- 20331 Bluffside Cir Unit 303
- 20331 Bluffside Cir Unit 222
- 20331 Bluffside Cir Unit A320
- 20331 Bluffside Cir Unit 417
- 8031 Sail Cir
- 8042 Ebbtide Cir
- 8061 Sail Cir
- 8032 Ebbtide Cir
- 8062 Ebbtide Cir
- 8021 Sail Cir
- 8071 Sail Cir
- 8022 Ebbtide Cir
- 8075 Ebbtide Cir
- 8073 Ebbtide Cir
- 8032 Sail Cir
- 8062 Sail Cir
- 8011 Sail Cir
- 8071 Ebbtide Cir
- 8022 Sail Cir
- 8012 Ebbtide Cir
- 8031 Ebbtide Cir
- 8041 Mermaid Cir
- 8012 Sail Cir
- 8041 Ebbtide Cir