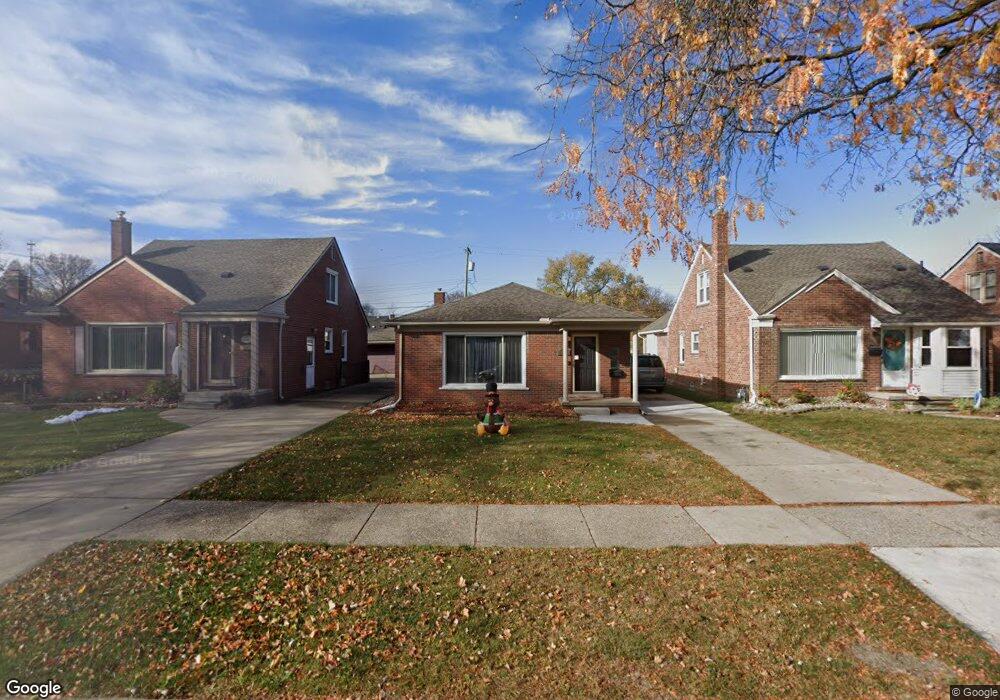
8044 Osage Ave Allen Park, MI 48101
Estimated Value: $236,161 - $248,000
3
Beds
2
Baths
1,100
Sq Ft
$220/Sq Ft
Est. Value
About This Home
This home is located at 8044 Osage Ave, Allen Park, MI 48101 and is currently estimated at $241,540, approximately $219 per square foot. 8044 Osage Ave is a home located in Wayne County with nearby schools including Bennie Elementary School, Allen Park Middle School, and Allen Park High School.
Ownership History
Date
Name
Owned For
Owner Type
Purchase Details
Closed on
Oct 22, 2010
Sold by
Daniel Trevor and Daniel Annette
Bought by
Smouthers Scott and Smouthers Stephanie
Current Estimated Value
Purchase Details
Closed on
May 23, 2008
Sold by
Daniel Annette R
Bought by
Daniel Annette R
Purchase Details
Closed on
Jul 20, 2006
Sold by
Wells Fargo Bank Na
Bought by
Grp Loan Llc
Purchase Details
Closed on
May 17, 2006
Sold by
Buchanan Robert and Buchanan Colleen
Bought by
Wells Fargo Bank Na and Dlj Abs Trust Series 2000-3 Mortgage Pas
Purchase Details
Closed on
Apr 28, 2000
Sold by
Anita M Kozlowski
Bought by
Robert Buchanan
Purchase Details
Closed on
Apr 19, 1996
Sold by
Kris Kozlowski
Bought by
Saif Hashim and Saif Wasim
Create a Home Valuation Report for This Property
The Home Valuation Report is an in-depth analysis detailing your home's value as well as a comparison with similar homes in the area
Home Values in the Area
Average Home Value in this Area
Purchase History
| Date | Buyer | Sale Price | Title Company |
|---|---|---|---|
| Smouthers Scott | $125,000 | Minnesota Title Agency | |
| Daniel Annette R | -- | Minnesota Title Agency | |
| Daniel Annette R | $79,900 | Mta | |
| Grp Loan Llc | -- | E Title Agency | |
| Wells Fargo Bank Na | $145,729 | None Available | |
| Robert Buchanan | $129,900 | -- | |
| Saif Hashim | $85,000 | -- |
Source: Public Records
Tax History Compared to Growth
Tax History
| Year | Tax Paid | Tax Assessment Tax Assessment Total Assessment is a certain percentage of the fair market value that is determined by local assessors to be the total taxable value of land and additions on the property. | Land | Improvement |
|---|---|---|---|---|
| 2025 | $2,583 | $105,500 | $0 | $0 |
| 2024 | $2,583 | $101,700 | $0 | $0 |
| 2023 | $2,468 | $93,400 | $0 | $0 |
| 2022 | $2,955 | $82,200 | $0 | $0 |
| 2021 | $2,874 | $75,200 | $0 | $0 |
| 2020 | $2,839 | $65,100 | $0 | $0 |
| 2019 | $2,819 | $62,900 | $0 | $0 |
| 2018 | $2,216 | $56,700 | $0 | $0 |
| 2017 | $1,084 | $56,100 | $0 | $0 |
| 2016 | $2,754 | $52,200 | $0 | $0 |
| 2015 | $4,346 | $47,800 | $0 | $0 |
| 2013 | $4,210 | $45,900 | $0 | $0 |
| 2012 | $2,398 | $44,200 | $12,600 | $31,600 |
Source: Public Records
Map
Nearby Homes
- 8027 Kolb Ave
- 7668 Cortland Ave
- 7639 Cortland Ave
- 7221 Winona Ave
- 15720 Jonas Ave
- 7853 Robinson Ave
- 7510 Balfour Ave
- 7868 Robinson Ave
- 8511 Allen Rd
- 7140 Luana Ave
- 7210 Buckingham Ave
- 7159 Luana Ave
- 15705 Champaign Rd
- 17439 Brody Ave
- 8319 Ziegler St
- 7713 Jackson St
- 8928 Becker Ave
- 7854 Jackson St
- 15570 Angelique Ave
- 20234 Champaign St
- 8036 Osage Ave
- 8050 Osage Ave
- 8058 Osage Ave
- 8028 Osage Ave
- 8020 Osage Ave
- 8066 Osage Ave
- 8045 Winona Ave
- 8053 Winona Ave
- 8037 Winona Ave
- 8061 Winona Ave
- 8074 Osage Ave
- 8012 Osage Ave
- 8029 Winona Ave
- 8069 Winona Ave
- 8041 Osage Ave
- 8021 Winona Ave
- 8004 Osage Ave
- 8084 Osage Ave
- 8027 Osage Ave
- 8077 Winona Ave