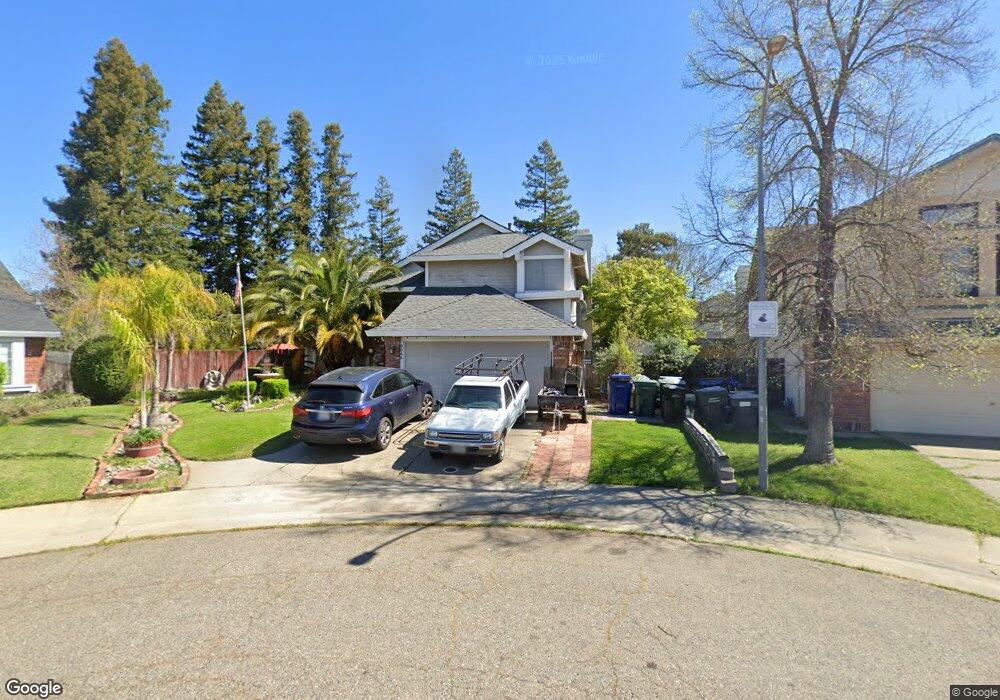
8045 Elnora Ct Sacramento, CA 95829
Estimated Value: $579,000 - $605,000
4
Beds
3
Baths
1,946
Sq Ft
$304/Sq Ft
Est. Value
About This Home
This home is located at 8045 Elnora Ct, Sacramento, CA 95829 and is currently estimated at $592,242, approximately $304 per square foot. 8045 Elnora Ct is a home located in Sacramento County with nearby schools including Maeola E. Beitzel Elementary School, T. R. Smedberg Middle School, and Sheldon High School.
Ownership History
Date
Name
Owned For
Owner Type
Purchase Details
Closed on
Jan 18, 2017
Sold by
Salais Alejo T and Salais Diane
Bought by
Salais Alejo T and Salais Diane M
Current Estimated Value
Home Financials for this Owner
Home Financials are based on the most recent Mortgage that was taken out on this home.
Original Mortgage
$340,000
Outstanding Balance
$280,510
Interest Rate
4.16%
Mortgage Type
VA
Estimated Equity
$311,732
Purchase Details
Closed on
Jan 10, 2017
Sold by
Department Of Veterans Affairs
Bought by
Salais Alejo T and Salais Diane
Home Financials for this Owner
Home Financials are based on the most recent Mortgage that was taken out on this home.
Original Mortgage
$340,000
Outstanding Balance
$280,510
Interest Rate
4.16%
Mortgage Type
VA
Estimated Equity
$311,732
Purchase Details
Closed on
Nov 13, 2003
Sold by
Rao Jagbir Singh and Singh Mignonne
Bought by
Va
Purchase Details
Closed on
Apr 28, 1999
Sold by
Granger Curtis H and Granger Jennifer C
Bought by
Rao Jagbir Singh and Singh Mignonne
Home Financials for this Owner
Home Financials are based on the most recent Mortgage that was taken out on this home.
Original Mortgage
$161,500
Interest Rate
6.98%
Create a Home Valuation Report for This Property
The Home Valuation Report is an in-depth analysis detailing your home's value as well as a comparison with similar homes in the area
Home Values in the Area
Average Home Value in this Area
Purchase History
| Date | Buyer | Sale Price | Title Company |
|---|---|---|---|
| Salais Alejo T | -- | Fidelity National Title Comp | |
| Salais Alejo T | -- | Fidelity National Title | |
| Va | $310,000 | Placer Title Company | |
| Rao Jagbir Singh | $170,000 | Chicago Title Co |
Source: Public Records
Mortgage History
| Date | Status | Borrower | Loan Amount |
|---|---|---|---|
| Open | Salais Alejo T | $340,000 | |
| Previous Owner | Rao Jagbir Singh | $161,500 |
Source: Public Records
Tax History Compared to Growth
Tax History
| Year | Tax Paid | Tax Assessment Tax Assessment Total Assessment is a certain percentage of the fair market value that is determined by local assessors to be the total taxable value of land and additions on the property. | Land | Improvement |
|---|---|---|---|---|
| 2025 | $3,038 | $440,737 | $78,190 | $362,547 |
| 2024 | $3,038 | $432,096 | $76,657 | $355,439 |
| 2023 | $3,021 | $423,624 | $75,154 | $348,470 |
| 2022 | $3,055 | $415,319 | $73,681 | $341,638 |
| 2021 | $3,018 | $407,177 | $72,237 | $334,940 |
| 2020 | $3,008 | $403,003 | $71,497 | $331,506 |
| 2019 | $2,967 | $395,102 | $70,096 | $325,006 |
| 2018 | $2,911 | $387,356 | $68,722 | $318,634 |
| 2017 | $2,876 | $379,762 | $67,375 | $312,387 |
| 2016 | $2,744 | $372,316 | $66,054 | $306,262 |
| 2015 | $2,687 | $366,724 | $65,062 | $301,662 |
| 2014 | $2,406 | $336,923 | $59,774 | $277,149 |
Source: Public Records
Map
Nearby Homes
- 8048 Caymus Dr
- 9040 Durness Way
- 8054 Boeger Ct
- 9172 Durness Way
- 9028 Brittany Park Dr
- 7984 Munhall Ct
- 8990 Chantal Way
- 9287 Benefield Ct
- 8977 Carlisle Ave
- 7929 Symington Way
- 7904 Symington Way
- 9244 Brevard Ct
- 9273 Amarone Way
- 9169 Garlington Ct
- 8880 Sonoma Valley Way
- 7926 Asiatic Lion Ct
- 9065 Robbins Rd
- 8916 Hollowstone Way
- 7920 Kelvedon Way
- 8269 Red Rock Dr
- 8041 Elnora Ct
- 8049 Elnora Ct
- 9093 Durness Way
- 8053 Elnora Ct
- 9089 Durness Way
- 8040 Elnora Ct
- 9085 Durness Way
- 8046 Elnora Ct
- 8057 Elnora Ct
- 8050 Elnora Ct
- 9078 Mirassou Ct
- 9081 Durness Way
- 9097 Durness Way
- 8070 Elnora Ct
- 9082 Mirassou Ct
- 9074 Mirassou Ct
- 8063 Cresta Blanca Ct
- 9070 Mirassou Ct
- 8061 Elnora Ct
- 9077 Durness Way