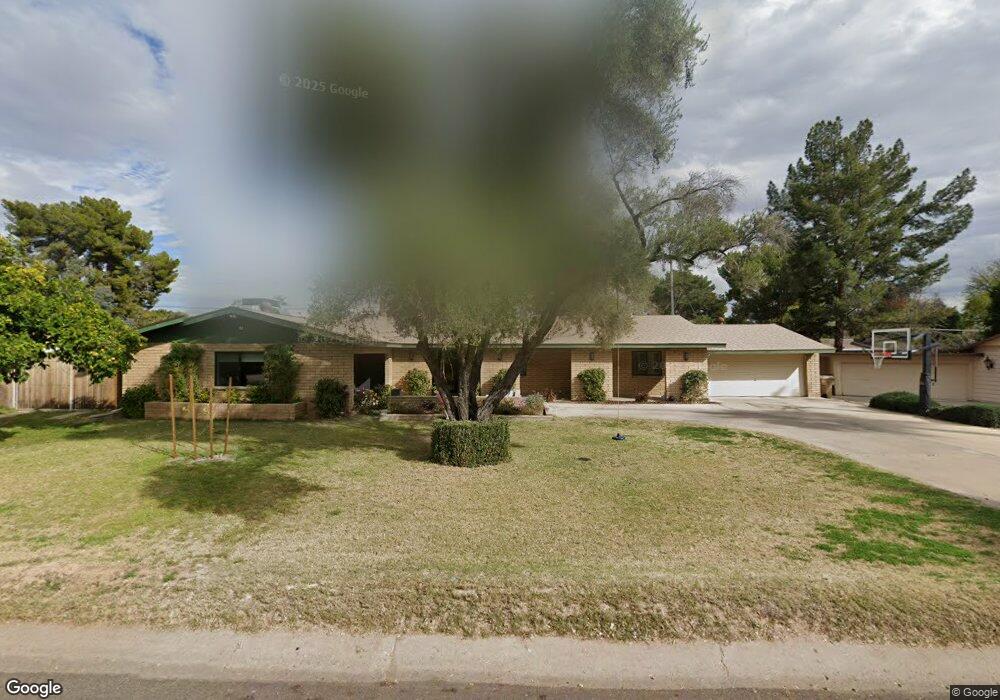
8045 N 8th Ave Phoenix, AZ 85021
North Central NeighborhoodEstimated Value: $801,000 - $1,084,000
3
Beds
3
Baths
2,564
Sq Ft
$387/Sq Ft
Est. Value
About This Home
This home is located at 8045 N 8th Ave, Phoenix, AZ 85021 and is currently estimated at $991,388, approximately $386 per square foot. 8045 N 8th Ave is a home located in Maricopa County with nearby schools including Richard E Miller School, Royal Palm Middle School, and Sunnyslope High School.
Ownership History
Date
Name
Owned For
Owner Type
Purchase Details
Closed on
Jul 30, 2014
Sold by
West Michael A and West Keri D
Bought by
Rathert Charles and Rathert Allyson
Current Estimated Value
Home Financials for this Owner
Home Financials are based on the most recent Mortgage that was taken out on this home.
Original Mortgage
$206,000
Outstanding Balance
$66,539
Interest Rate
4.11%
Mortgage Type
New Conventional
Estimated Equity
$924,849
Purchase Details
Closed on
May 2, 2011
Sold by
Labossiere Robert J and The Robert J Labosiere Trust
Bought by
West Michael A and West Keri D
Home Financials for this Owner
Home Financials are based on the most recent Mortgage that was taken out on this home.
Original Mortgage
$336,254
Interest Rate
4.87%
Mortgage Type
FHA
Purchase Details
Closed on
Jul 19, 2001
Sold by
Labossiere Robert and Scott Peggy
Bought by
Labossiere Robert J and Scott Peggy C
Create a Home Valuation Report for This Property
The Home Valuation Report is an in-depth analysis detailing your home's value as well as a comparison with similar homes in the area
Home Values in the Area
Average Home Value in this Area
Purchase History
| Date | Buyer | Sale Price | Title Company |
|---|---|---|---|
| Rathert Charles | $424,000 | First Arizona Title Agency | |
| West Michael A | $345,000 | Security Title Agency | |
| Labossiere Robert J | -- | -- |
Source: Public Records
Mortgage History
| Date | Status | Borrower | Loan Amount |
|---|---|---|---|
| Open | Rathert Charles | $206,000 | |
| Previous Owner | West Michael A | $336,254 |
Source: Public Records
Tax History
| Year | Tax Paid | Tax Assessment Tax Assessment Total Assessment is a certain percentage of the fair market value that is determined by local assessors to be the total taxable value of land and additions on the property. | Land | Improvement |
|---|---|---|---|---|
| 2025 | $6,832 | $48,273 | -- | -- |
| 2024 | $5,309 | $45,974 | -- | -- |
| 2023 | $5,309 | $67,620 | $13,520 | $54,100 |
| 2022 | $5,120 | $53,920 | $10,780 | $43,140 |
| 2021 | $5,170 | $49,680 | $9,930 | $39,750 |
| 2020 | $5,027 | $51,110 | $10,220 | $40,890 |
| 2019 | $4,915 | $46,430 | $9,280 | $37,150 |
| 2018 | $4,773 | $43,670 | $8,730 | $34,940 |
| 2017 | $4,252 | $42,430 | $8,480 | $33,950 |
| 2016 | $4,154 | $40,010 | $8,000 | $32,010 |
| 2015 | $3,880 | $36,010 | $7,200 | $28,810 |
Source: Public Records
Map
Nearby Homes
- 8037 N 7th Ave
- 524 W Harmont Dr
- 7830 N 7th Ave
- 8001 N 5th Ave
- 641 W Linger Ln
- 7848 N 5th Ave
- 1001 W Northern Ave
- 514 W Hayward Ave
- 7730 N 7th Ave
- 8324 N 8th Ave
- 625 W Echo Ln
- 8464 N 7th Ave
- 640 W Echo Ln
- 223 W Augusta Ave
- 7720 N 3rd Ave
- 100 W Northern Ave Unit 6
- 100 W Northern Ave Unit 7
- 100 W Northern Ave Unit 15
- 100 W Northern Ave Unit 4
- 501 W Seldon Ln
- 8047 N 8th Ave
- 8039 N 8th Ave
- 8109 N 8th Ave
- 8048 N 7th Ave
- 8040 N 7th Ave
- 8102 N 7th Ave
- 8048 N 8th Ave
- 8040 N 8th Ave
- 8104 N 8th Ave
- 8031 N 8th Ave
- 8113 N 8th Ave
- 8032 N 7th Ave
- 8114 N 7th Ave
- 8032 N 8th Ave
- 8112 N 8th Ave
- 8047 N 9th Ave
- 8023 N 8th Ave
- 523 W Harmont Dr
- 8043 N 9th Ave
- 8103 N 9th Ave
Your Personal Tour Guide
Ask me questions while you tour the home.