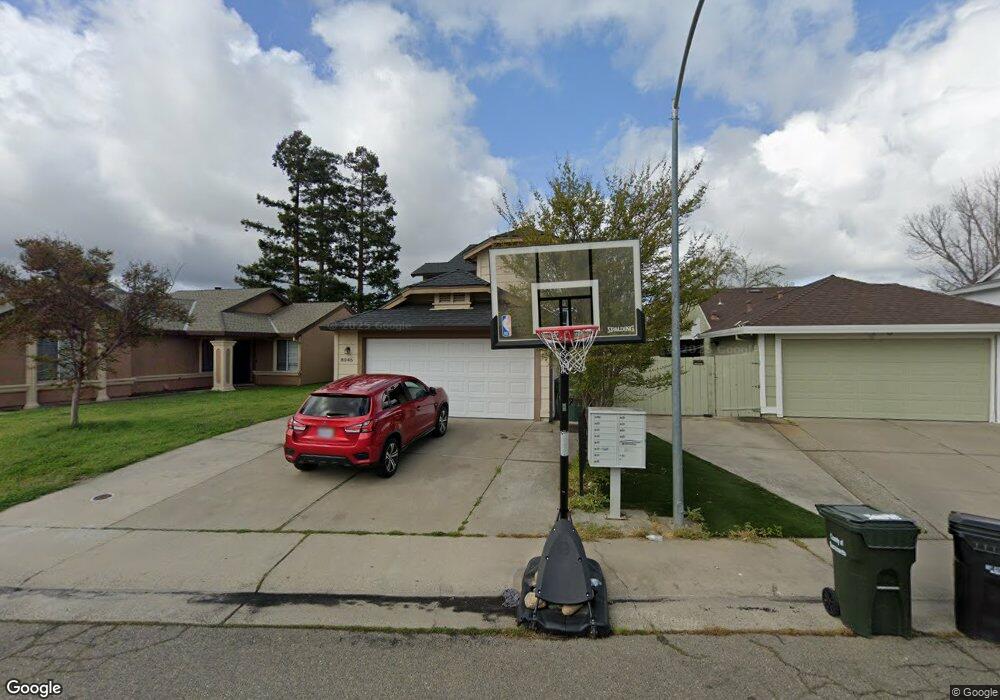
8046 Lomand Ct Sacramento, CA 95828
Estimated Value: $294,000 - $514,000
4
Beds
3
Baths
1,588
Sq Ft
$282/Sq Ft
Est. Value
About This Home
This home is located at 8046 Lomand Ct, Sacramento, CA 95828 and is currently estimated at $448,147, approximately $282 per square foot. 8046 Lomand Ct is a home located in Sacramento County with nearby schools including Mary Tsukamoto Elementary School, T. R. Smedberg Middle School, and Sheldon High School.
Ownership History
Date
Name
Owned For
Owner Type
Purchase Details
Closed on
Dec 5, 2012
Sold by
Barrantes Rene and Barrantes Daysi
Bought by
Thr California Lp
Current Estimated Value
Purchase Details
Closed on
Nov 28, 2001
Sold by
Vantran Hieu and Pham Mo Thi
Bought by
Barrantes Rene and Barrantes Daysi
Home Financials for this Owner
Home Financials are based on the most recent Mortgage that was taken out on this home.
Original Mortgage
$172,562
Interest Rate
6.57%
Mortgage Type
FHA
Purchase Details
Closed on
Oct 24, 2001
Sold by
Tran Hoa Duc
Bought by
Vantran Hieu Van and Pham Mo Thi
Home Financials for this Owner
Home Financials are based on the most recent Mortgage that was taken out on this home.
Original Mortgage
$172,562
Interest Rate
6.57%
Mortgage Type
FHA
Create a Home Valuation Report for This Property
The Home Valuation Report is an in-depth analysis detailing your home's value as well as a comparison with similar homes in the area
Home Values in the Area
Average Home Value in this Area
Purchase History
| Date | Buyer | Sale Price | Title Company |
|---|---|---|---|
| Thr California Lp | $146,000 | None Available | |
| Barrantes Rene | $175,000 | First American Title Ins Co | |
| Vantran Hieu Van | $87,500 | First American Title Ins Co |
Source: Public Records
Mortgage History
| Date | Status | Borrower | Loan Amount |
|---|---|---|---|
| Previous Owner | Barrantes Rene | $172,562 |
Source: Public Records
Tax History Compared to Growth
Tax History
| Year | Tax Paid | Tax Assessment Tax Assessment Total Assessment is a certain percentage of the fair market value that is determined by local assessors to be the total taxable value of land and additions on the property. | Land | Improvement |
|---|---|---|---|---|
| 2025 | $3,621 | $330,760 | $104,449 | $226,311 |
| 2024 | $3,621 | $324,275 | $102,401 | $221,874 |
| 2023 | $3,531 | $317,918 | $100,394 | $217,524 |
| 2022 | $3,471 | $311,685 | $98,426 | $213,259 |
| 2021 | $3,434 | $305,575 | $96,497 | $209,078 |
| 2020 | $3,388 | $302,443 | $95,508 | $206,935 |
| 2019 | $3,547 | $317,322 | $93,636 | $223,686 |
| 2018 | $1,779 | $151,512 | $32,466 | $119,046 |
| 2017 | $1,750 | $148,542 | $31,830 | $116,712 |
| 2016 | $1,666 | $145,630 | $31,206 | $114,424 |
| 2015 | $1,637 | $143,444 | $30,738 | $112,706 |
| 2014 | $1,612 | $140,635 | $30,136 | $110,499 |
Source: Public Records
Map
Nearby Homes
- 8034 Kelty Ct
- 8005 Delage Way
- 8716 Cord Way
- 8916 Hollowstone Way
- 8247 Derbyshire Cir
- 8170 Derbyshire Cir
- 8880 Sonoma Valley Way
- 8159 Morgan Hill Way
- 8798 Caselman Rd
- 7926 Asiatic Lion Ct
- 8733 Nakota Way
- 8977 Carlisle Ave
- 8772 Crusheen Way
- 8837 Navarrin Way
- 7790 Finnhorse Way
- 8216 Exbourne Cir
- 8902 Cobble Crest Dr
- 8906 Cobble Crest Dr
- 8932 Caselman Rd
- 8800 Tiogawoods Dr
- 8050 Lomand Ct
- 8042 Lomand Ct
- 8054 Lomand Ct
- 8038 Lomand Ct
- 8045 Kirkton Ct
- 8049 Kirkton Ct
- 8041 Kirkton Ct
- 8058 Lomand Ct
- 8034 Lomand Ct
- 8053 Kirkton Ct
- 8037 Kirkton Ct
- 8045 Lomand Ct
- 8041 Lomond Ct
- 8049 Lomand Ct
- 8037 Lomand Ct
- 8062 Lomand Ct
- 8057 Kirkton Ct
- 8030 Lomand Ct
- 8053 Lomand Ct
- 8033 Kirkton Ct