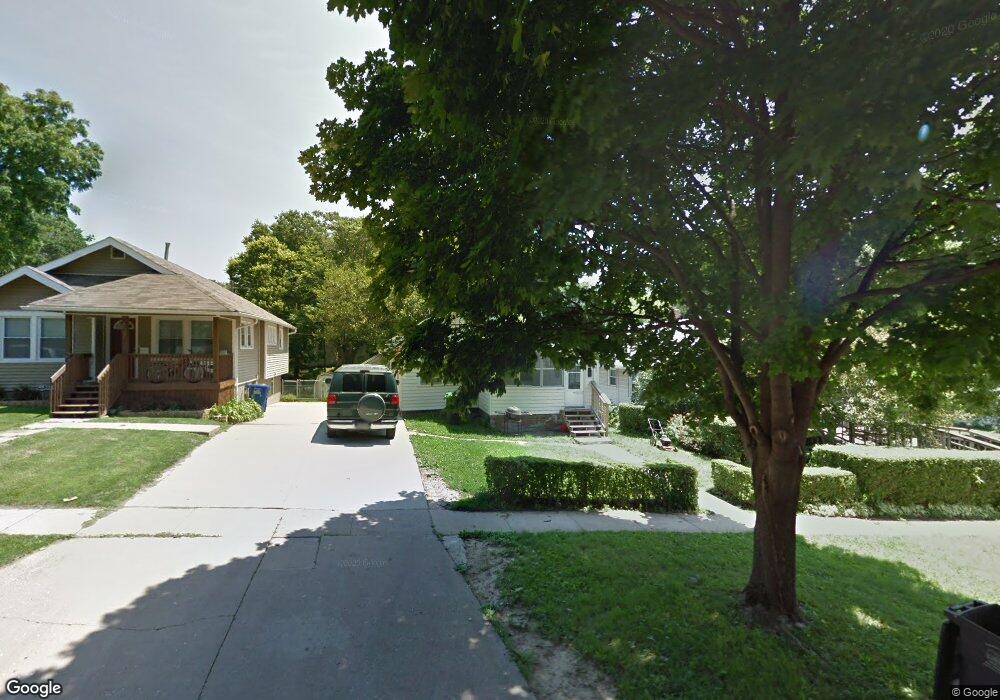
805 25th St Des Moines, IA 50312
Woodland Heights NeighborhoodEstimated Value: $138,421 - $189,000
2
Beds
1
Bath
787
Sq Ft
$199/Sq Ft
Est. Value
About This Home
This home is located at 805 25th St, Des Moines, IA 50312 and is currently estimated at $156,605, approximately $198 per square foot. 805 25th St is a home located in Polk County with nearby schools including Greenwood Elementary School, Callanan Middle School, and Roosevelt High School.
Ownership History
Date
Name
Owned For
Owner Type
Purchase Details
Closed on
Aug 28, 2001
Sold by
Creative Homes Inc
Bought by
Johnson Lavette M
Current Estimated Value
Home Financials for this Owner
Home Financials are based on the most recent Mortgage that was taken out on this home.
Original Mortgage
$62,080
Outstanding Balance
$28,890
Interest Rate
9.87%
Estimated Equity
$127,715
Purchase Details
Closed on
Mar 14, 2001
Sold by
Reed Kevin James
Bought by
Creative Homes Inc
Home Financials for this Owner
Home Financials are based on the most recent Mortgage that was taken out on this home.
Original Mortgage
$51,200
Interest Rate
7.13%
Create a Home Valuation Report for This Property
The Home Valuation Report is an in-depth analysis detailing your home's value as well as a comparison with similar homes in the area
Home Values in the Area
Average Home Value in this Area
Purchase History
| Date | Buyer | Sale Price | Title Company |
|---|---|---|---|
| Johnson Lavette M | $63,500 | -- | |
| Creative Homes Inc | $43,500 | -- |
Source: Public Records
Mortgage History
| Date | Status | Borrower | Loan Amount |
|---|---|---|---|
| Open | Johnson Lavette M | $62,080 | |
| Previous Owner | Creative Homes Inc | $51,200 |
Source: Public Records
Tax History
| Year | Tax Paid | Tax Assessment Tax Assessment Total Assessment is a certain percentage of the fair market value that is determined by local assessors to be the total taxable value of land and additions on the property. | Land | Improvement |
|---|---|---|---|---|
| 2025 | $1,976 | $126,100 | $28,300 | $97,800 |
| 2024 | $1,976 | $110,900 | $24,900 | $86,000 |
| 2023 | $1,848 | $110,900 | $24,900 | $86,000 |
| 2022 | $1,832 | $87,300 | $20,300 | $67,000 |
| 2021 | $1,720 | $87,300 | $20,300 | $67,000 |
| 2020 | $1,780 | $77,500 | $18,100 | $59,400 |
| 2019 | $1,612 | $77,500 | $18,100 | $59,400 |
| 2018 | $1,590 | $68,500 | $15,800 | $52,700 |
| 2017 | $1,520 | $68,500 | $15,800 | $52,700 |
| 2016 | $1,476 | $64,700 | $14,900 | $49,800 |
| 2015 | $1,476 | $64,700 | $14,900 | $49,800 |
| 2014 | $1,282 | $59,000 | $13,500 | $45,500 |
Source: Public Records
Map
Nearby Homes
Your Personal Tour Guide
Ask me questions while you tour the home.