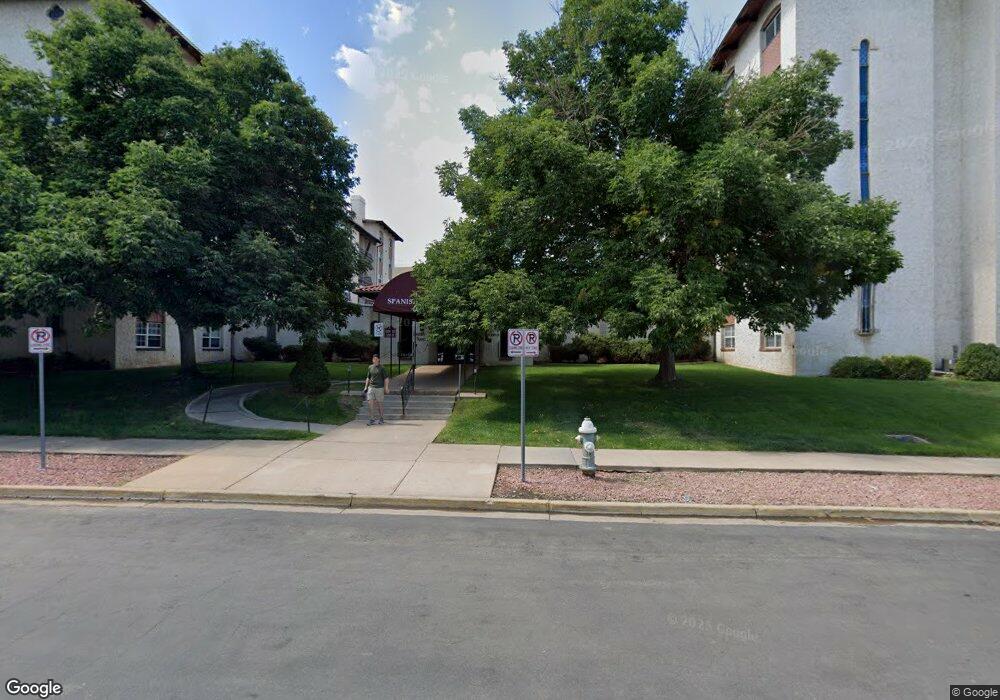
805 29th St Unit 407 Boulder, CO 80303
University of Colorado Boulder Area NeighborhoodEstimated Value: $313,000 - $327,000
1
Bed
1
Bath
708
Sq Ft
$453/Sq Ft
Est. Value
About This Home
This home is located at 805 29th St Unit 407, Boulder, CO 80303 and is currently estimated at $320,419, approximately $452 per square foot. 805 29th St Unit 407 is a home located in Boulder County with nearby schools including Creekside Elementary School, Manhattan Middle School of the Arts & Academics, and Fairview High School.
Ownership History
Date
Name
Owned For
Owner Type
Purchase Details
Closed on
Feb 7, 2013
Sold by
Spanish Towers Rentals Llc
Bought by
Nsb Rentals Llc
Current Estimated Value
Purchase Details
Closed on
Mar 5, 2009
Sold by
Anderson John C and Anderson Gertrude E
Bought by
Spanish Towers Rentals Llc
Purchase Details
Closed on
Dec 17, 1993
Sold by
Kridel H Martin
Bought by
Anderson John C
Home Financials for this Owner
Home Financials are based on the most recent Mortgage that was taken out on this home.
Original Mortgage
$35,000
Interest Rate
7.19%
Purchase Details
Closed on
Apr 28, 1992
Bought by
Nsb Rentals Llc
Purchase Details
Closed on
Oct 4, 1988
Bought by
Nsb Rentals Llc
Purchase Details
Closed on
Aug 16, 1982
Bought by
Nsb Rentals Llc
Create a Home Valuation Report for This Property
The Home Valuation Report is an in-depth analysis detailing your home's value as well as a comparison with similar homes in the area
Home Values in the Area
Average Home Value in this Area
Purchase History
| Date | Buyer | Sale Price | Title Company |
|---|---|---|---|
| Nsb Rentals Llc | -- | None Available | |
| Spanish Towers Rentals Llc | $119,900 | Utc Colorado | |
| Anderson John C | $19,833 | -- | |
| Anderson John C | $39,666 | -- | |
| Nsb Rentals Llc | -- | -- | |
| Nsb Rentals Llc | -- | -- | |
| Nsb Rentals Llc | $62,700 | -- |
Source: Public Records
Mortgage History
| Date | Status | Borrower | Loan Amount |
|---|---|---|---|
| Previous Owner | Anderson John C | $35,000 |
Source: Public Records
Tax History Compared to Growth
Tax History
| Year | Tax Paid | Tax Assessment Tax Assessment Total Assessment is a certain percentage of the fair market value that is determined by local assessors to be the total taxable value of land and additions on the property. | Land | Improvement |
|---|---|---|---|---|
| 2025 | $1,695 | $20,900 | -- | $20,900 |
| 2024 | $1,695 | $20,900 | -- | $20,900 |
| 2023 | $1,663 | $18,393 | -- | $22,078 |
| 2022 | $1,985 | $20,565 | $0 | $20,565 |
| 2021 | $1,896 | $21,157 | $0 | $21,157 |
| 2020 | $1,610 | $18,497 | $0 | $18,497 |
| 2019 | $1,585 | $18,497 | $0 | $18,497 |
| 2018 | $1,342 | $15,480 | $0 | $15,480 |
| 2017 | $1,300 | $19,343 | $0 | $19,343 |
| 2016 | $1,220 | $14,089 | $0 | $14,089 |
| 2015 | $1,155 | $11,144 | $0 | $11,144 |
| 2014 | $958 | $11,144 | $0 | $11,144 |
Source: Public Records
Map
Nearby Homes
- 805 29th St Unit 253
- 805 29th St Unit 504
- 2877 Moorhead Ave
- 2850 E College Ave Unit 110
- 3009 Madison Ave Unit M-315
- 340 29th St
- 3000 Colorado Ave Unit F122
- 3000 Colorado Ave Unit D114
- 3000 Colorado Ave Unit 122F
- 3000 Colorado Ave Unit B206
- 385 32nd St
- 325 27th St
- 2801 Pennsylvania Ave Unit 203
- 905 36th St
- 2250 Bluebell Ave
- 2802 Sundown Ln Unit 102
- 2960 Shadow Creek Dr Unit 101
- 2800 Sundown Ln Unit 109
- 2207 Bluebell Ave
- 2865 Sundown Ln Unit 108
- 805 29th St Unit 562
- 805 29th St Unit 561
- 805 29th St Unit 560
- 805 29th St Unit 559
- 805 29th St Unit 558
- 805 29th St Unit 557
- 805 29th St Unit 556
- 805 29th St Unit 555
- 805 29th St Unit 554
- 805 29th St Unit 553
- 805 29th St Unit 552
- 805 29th St Unit 551
- 805 29th St Unit 512
- 805 29th St Unit 511
- 805 29th St Unit 510
- 805 29th St Unit 509
- 805 29th St Unit 508
- 805 29th St Unit 507
- 805 29th St Unit 506
- 805 29th St Unit 505