
805 29th St Unit 561 Boulder, CO 80303
4
Beds
2
Baths
1,400
Sq Ft
1969
Built
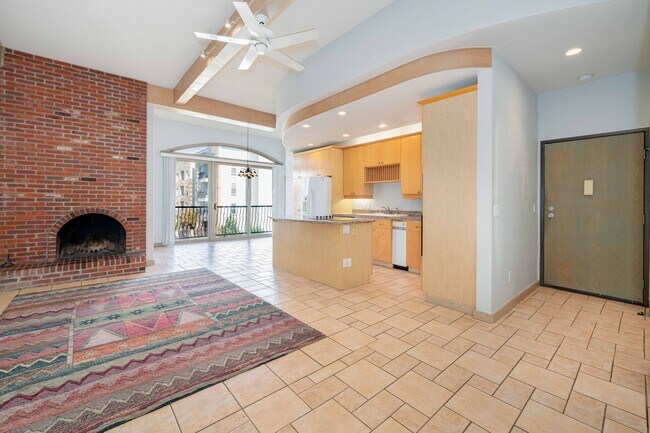
About This Home
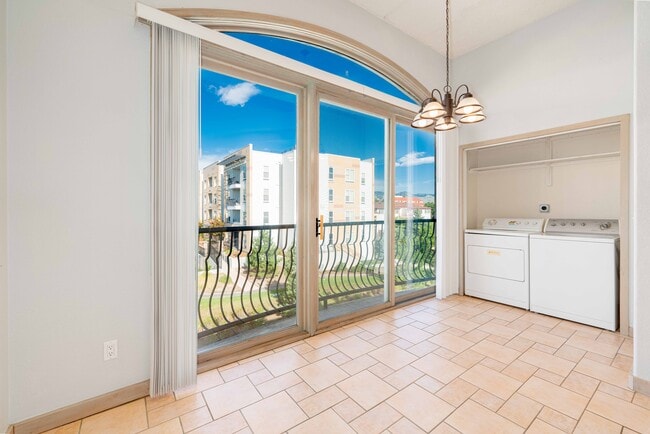
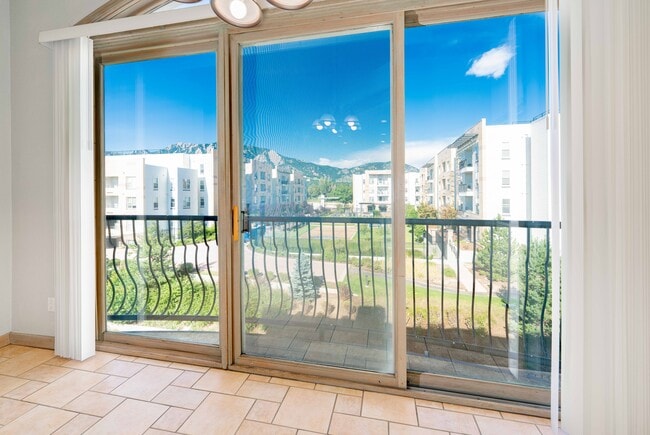
This apartment is located at 805 29th St Unit 561, Boulder, CO 80303 and is currently priced between $5,500. This property was built in 1969. 805 29th St Unit 561 is a home located in Boulder County with nearby schools including Creekside Elementary School, Manhattan Middle School of the Arts & Academics, and Fairview High School.
Listing Provided By

Map
Nearby Homes
- 805 29th St Unit 253
- 805 29th St Unit 504
- 2800 Aurora Ave Unit 121
- 2877 Moorhead Ave
- 2830 E College Ave Unit 311
- 2850 E College Ave Unit 110
- 755 34th St
- 3000 Colorado Ave Unit B206
- 385 32nd St
- 325 27th St
- 3460 Madison Ave
- 2801 Pennsylvania Ave Unit 203
- 905 36th St
- 925 36th St
- 2250 Bluebell Ave
- 2802 Sundown Ln Unit 102
- 2960 Shadow Creek Dr Unit 101
- 2800 Sundown Ln Unit 109
- 995 37th St
- 2865 Sundown Ln Unit 108