Estimated Value: $456,000 - $478,000
3
Beds
4
Baths
2,310
Sq Ft
$203/Sq Ft
Est. Value
About This Home
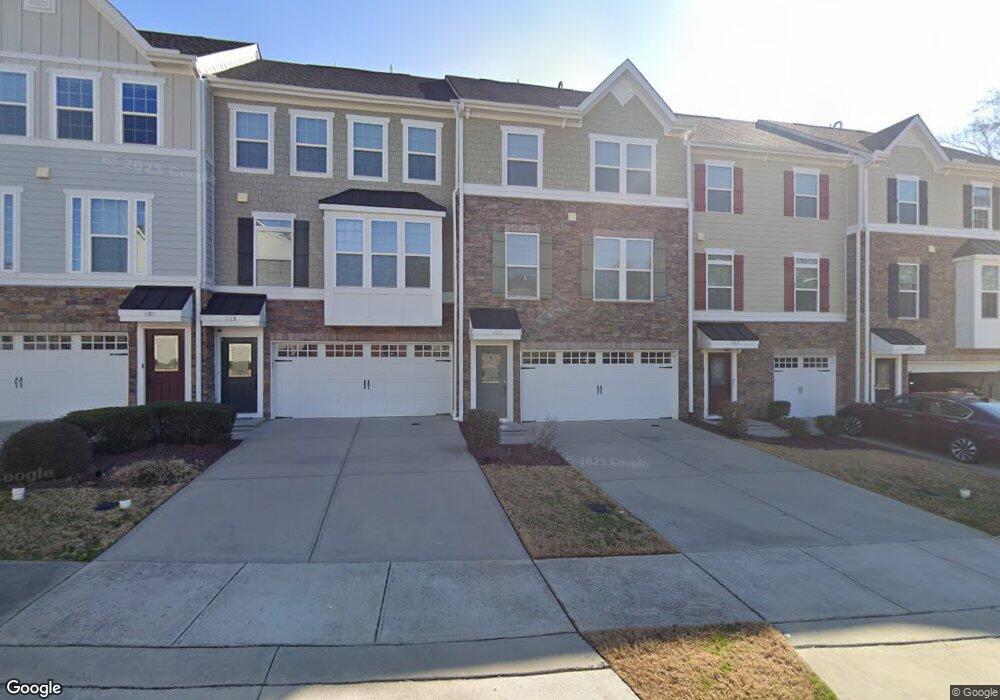
This home is located at 805 Ambergate Station, Apex, NC 27502 and is currently estimated at $468,127, approximately $202 per square foot. 805 Ambergate Station is a home located in Wake County with nearby schools including Salem Elementary, Salem Middle, and Apex High School.
Ownership History
Date
Name
Owned For
Owner Type
Purchase Details
Closed on
Dec 1, 2020
Sold by
Tademeti Chakrapani and Tademeti Sunanda
Bought by
Katepally Prashanth Reddy and Gowreddy Haritha
Current Estimated Value
Home Financials for this Owner
Home Financials are based on the most recent Mortgage that was taken out on this home.
Original Mortgage
$236,250
Outstanding Balance
$210,708
Interest Rate
2.8%
Mortgage Type
New Conventional
Estimated Equity
$257,419
Purchase Details
Closed on
Dec 3, 2015
Sold by
Apex First Development Llc
Bought by
Nvr Inc and Ryan Homes
Purchase Details
Closed on
Jan 30, 2015
Sold by
Nvr Inc
Bought by
Tademeti Chakrapani and Tademeti Sunanda
Home Financials for this Owner
Home Financials are based on the most recent Mortgage that was taken out on this home.
Original Mortgage
$190,833
Interest Rate
3.88%
Mortgage Type
New Conventional
Create a Home Valuation Report for This Property
The Home Valuation Report is an in-depth analysis detailing your home's value as well as a comparison with similar homes in the area
Home Values in the Area
Average Home Value in this Area
Purchase History
| Date | Buyer | Sale Price | Title Company |
|---|---|---|---|
| Katepally Prashanth Reddy | $315,000 | None Available | |
| Nvr Inc | $348,000 | None Available | |
| Tademeti Chakrapani | $254,500 | None Available |
Source: Public Records
Mortgage History
| Date | Status | Borrower | Loan Amount |
|---|---|---|---|
| Open | Katepally Prashanth Reddy | $236,250 | |
| Previous Owner | Tademeti Chakrapani | $190,833 |
Source: Public Records
Tax History Compared to Growth
Tax History
| Year | Tax Paid | Tax Assessment Tax Assessment Total Assessment is a certain percentage of the fair market value that is determined by local assessors to be the total taxable value of land and additions on the property. | Land | Improvement |
|---|---|---|---|---|
| 2025 | $4,250 | $484,472 | $105,000 | $379,472 |
| 2024 | $4,155 | $484,472 | $105,000 | $379,472 |
| 2023 | $3,443 | $312,062 | $55,000 | $257,062 |
| 2022 | $3,233 | $312,062 | $55,000 | $257,062 |
| 2021 | $3,109 | $312,062 | $55,000 | $257,062 |
| 2020 | $3,078 | $312,062 | $55,000 | $257,062 |
| 2019 | $3,059 | $267,628 | $55,000 | $212,628 |
| 2018 | $2,882 | $267,628 | $55,000 | $212,628 |
| 2017 | $2,683 | $267,628 | $55,000 | $212,628 |
| 2016 | $2,644 | $267,628 | $55,000 | $212,628 |
| 2015 | $2,086 | $58,000 | $58,000 | $0 |
Source: Public Records
Map
Nearby Homes
- 919 Branch Line Ln
- 1808 N Salem St
- 953 Ambergate Station
- 996 Tender Dr
- 1003 Lathrop Ln
- 810 Richmont Grove Ln
- 904 Dalton Ridge Place
- 1111 Platform Dr
- 1115 Platform Dr
- 958 Bay Bouquet Ln
- 903 Norwood Ln
- 612 Cable Ct
- Weston End Unit Plan at Parc at Bradley Farm
- Harrington End Unit Plan at Parc at Bradley Farm
- Harrington Interior Unit Plan at Parc at Bradley Farm
- 1000 Oakgate Ct
- 946 Steel Mill Ln
- 1702 Old London Way
- 596 Grand Central Station
- 1028 Holt Rd
- 803 Ambergate Station
- 803 Ambergate Station Unit 1001D
- 1126 Boxcar Way
- 801 Ambergate Station
- 807 Ambergate Station
- 807 Ambergate Station Unit 1001B
- 809 Ambergate Station
- 1117 Boxcar Way
- 1117 Boxcar Way Unit A
- 1117 Boxcar Way Unit 1002 A
- 1115 Boxcar Way
- 1113 Boxcar Way Unit 1002C
- 1113 Boxcar Way
- 1135 Boxcar Way
- 1111 Boxcar Way Unit 1002 D
- 1111 Boxcar Way
- 1122 Boxcar Way Unit 1005/B
- 1137 Boxcar Way
- 1124 Boxcar Way
- 1120 Boxcar Way