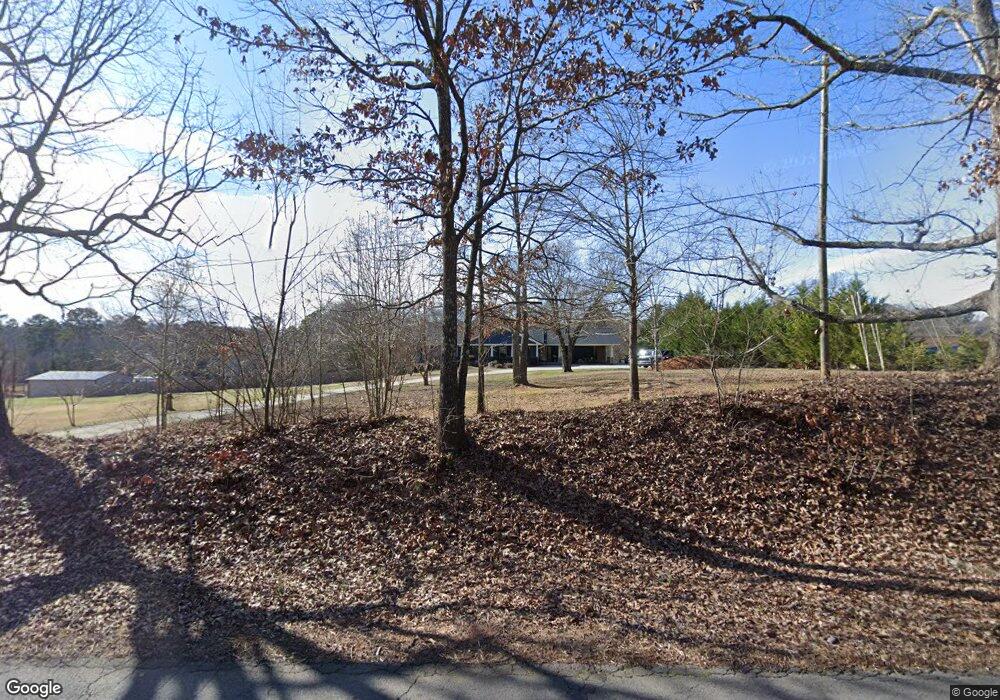
805 Clarence Edwards Rd Bethlehem, GA 30620
Estimated Value: $349,911 - $401,000
3
Beds
2
Baths
2,003
Sq Ft
$191/Sq Ft
Est. Value
About This Home
This home is located at 805 Clarence Edwards Rd, Bethlehem, GA 30620 and is currently estimated at $381,728, approximately $190 per square foot. 805 Clarence Edwards Rd is a home located in Barrow County with nearby schools including Yargo Elementary School, Haymon-Morris Middle School, and Apalachee High School.
Ownership History
Date
Name
Owned For
Owner Type
Purchase Details
Closed on
Nov 5, 2015
Sold by
Gardner Tracie L
Bought by
Gardner Tracie L and Gardner Rodney D
Current Estimated Value
Home Financials for this Owner
Home Financials are based on the most recent Mortgage that was taken out on this home.
Original Mortgage
$144,000
Outstanding Balance
$59,016
Interest Rate
3.78%
Mortgage Type
New Conventional
Estimated Equity
$322,712
Purchase Details
Closed on
Jan 3, 2007
Sold by
Robert W Chewning Llc
Bought by
Gardner Rodney D and Gardner Tracie L
Home Financials for this Owner
Home Financials are based on the most recent Mortgage that was taken out on this home.
Original Mortgage
$180,000
Interest Rate
6.07%
Mortgage Type
New Conventional
Purchase Details
Closed on
Apr 14, 2006
Sold by
Andrews Joe
Bought by
Chewning Robert W Llc
Create a Home Valuation Report for This Property
The Home Valuation Report is an in-depth analysis detailing your home's value as well as a comparison with similar homes in the area
Home Values in the Area
Average Home Value in this Area
Purchase History
| Date | Buyer | Sale Price | Title Company |
|---|---|---|---|
| Gardner Tracie L | -- | -- | |
| Gardner Rodney D | $200,000 | -- | |
| Chewning Robert W Llc | $35,500 | -- |
Source: Public Records
Mortgage History
| Date | Status | Borrower | Loan Amount |
|---|---|---|---|
| Open | Gardner Tracie L | $144,000 | |
| Previous Owner | Gardner Rodney D | $180,000 |
Source: Public Records
Tax History Compared to Growth
Tax History
| Year | Tax Paid | Tax Assessment Tax Assessment Total Assessment is a certain percentage of the fair market value that is determined by local assessors to be the total taxable value of land and additions on the property. | Land | Improvement |
|---|---|---|---|---|
| 2024 | $2,755 | $114,969 | $18,000 | $96,969 |
| 2023 | $2,330 | $114,969 | $18,000 | $96,969 |
| 2022 | $1,899 | $69,397 | $11,600 | $57,797 |
| 2021 | $2,001 | $69,397 | $11,600 | $57,797 |
| 2020 | $2,004 | $69,397 | $11,600 | $57,797 |
| 2019 | $1,887 | $64,428 | $11,600 | $52,828 |
| 2018 | $1,868 | $64,630 | $11,600 | $53,030 |
| 2017 | $1,676 | $57,562 | $11,600 | $45,962 |
| 2016 | $1,576 | $55,999 | $11,600 | $44,399 |
| 2015 | $1,600 | $56,560 | $11,600 | $44,960 |
| 2014 | $1,496 | $52,406 | $6,860 | $45,546 |
| 2013 | -- | $50,366 | $6,860 | $43,506 |
Source: Public Records
Map
Nearby Homes
- 758 Clarence Edwards Rd
- 190 Lokeys Ln
- 303 Ron Dr
- 0 Jb Owens Unit 7552902
- 0 Jb Owens Unit 7552891
- 0 Jb Owens Unit LOT 2 - 2.09 ACRES
- 0 Jb Owens Unit LOT 3 - 2.01 ACRES
- 209 Angie Way
- 575 Mackinaw Dr
- 1111 Otis Dr
- 1129 Loganville Hwy
- 236 Vision St
- 176 Market St
- 14 Smithwood Dr
- 755 Harry McCarty Rd
- 220 Carl Bethlehem Rd SW
- 1024 Lyndhurst Ln
- 763 Moss Side Dr
- 637 Sleeping Meadow Ln
- 0 Tanners Bridge Rd Unit 10588144
- 797 Clarence Edwards Rd
- 463 Harvey Lokey Rd
- 815 Clarence Edwards Rd
- 808 Clarence Edwards Rd
- 802 Clarence Edwards Rd
- 794 Clarence Edwards Rd
- 441 Harvey Lokey Rd
- 787 Clarence Edwards Rd
- 784 Clarence Edwards Rd
- 0 Emmett Rd Unit 8770186
- 454 Harvey Lokey Rd Unit 1
- 401 Harvey Lokey Rd
- 779 Clarence Edwards Rd
- 446 Harvey Lokey Rd
- 446 Harvey Lokey Rd Unit 2
- 442 Harvey Lokey Rd Unit 3
- 776 Clarence Edwards Rd
- 493 Harvey Lokey Rd
- 440 Harvey Lokey Rd
- 440 Harvey Lokey Rd Unit 4