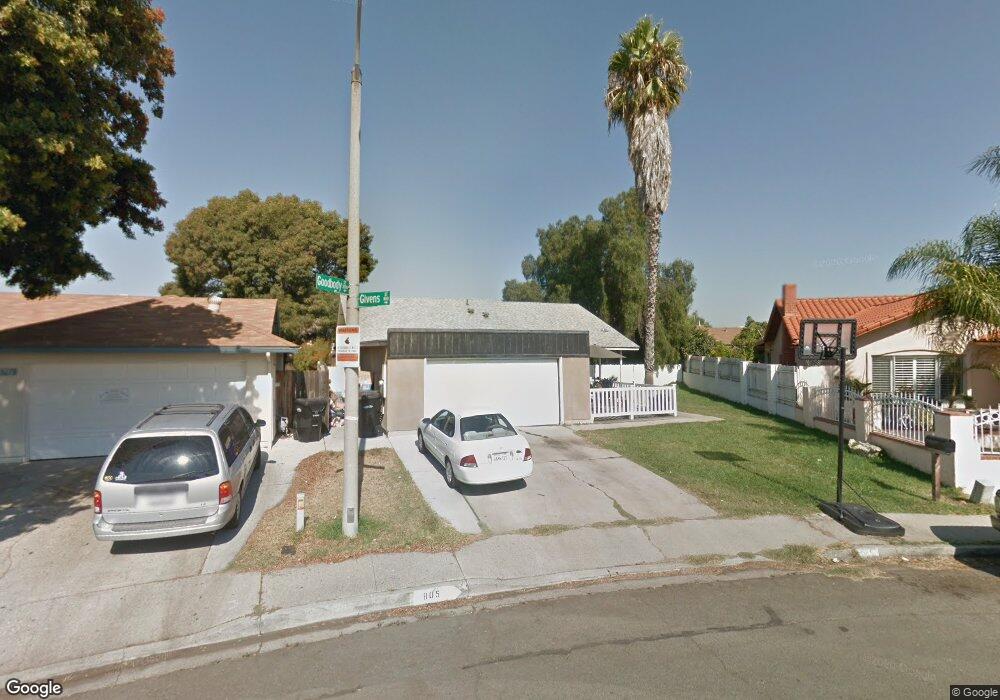
805 Givens St San Diego, CA 92154
Otay Mesa West NeighborhoodEstimated Value: $735,000 - $779,388
4
Beds
2
Baths
1,280
Sq Ft
$587/Sq Ft
Est. Value
About This Home
This home is located at 805 Givens St, San Diego, CA 92154 and is currently estimated at $751,847, approximately $587 per square foot. 805 Givens St is a home located in San Diego County with nearby schools including Silver Wing Elementary School, Montgomery Middle School, and Montgomery Senior High School.
Ownership History
Date
Name
Owned For
Owner Type
Purchase Details
Closed on
Mar 18, 2019
Sold by
Flores Jose M
Bought by
Flores Jose M and Flores Jose De Jesus
Current Estimated Value
Purchase Details
Closed on
Apr 2, 2015
Sold by
Flores Maria D Jesus
Bought by
Flores Jose M
Home Financials for this Owner
Home Financials are based on the most recent Mortgage that was taken out on this home.
Original Mortgage
$306,850
Interest Rate
3.63%
Mortgage Type
New Conventional
Purchase Details
Closed on
Mar 11, 2015
Sold by
U S Bank National Association
Bought by
Flores Jose M
Home Financials for this Owner
Home Financials are based on the most recent Mortgage that was taken out on this home.
Original Mortgage
$306,850
Interest Rate
3.63%
Mortgage Type
New Conventional
Purchase Details
Closed on
Jun 18, 2014
Sold by
Gagliardi Judith
Bought by
U S Bank National Association
Create a Home Valuation Report for This Property
The Home Valuation Report is an in-depth analysis detailing your home's value as well as a comparison with similar homes in the area
Home Values in the Area
Average Home Value in this Area
Purchase History
| Date | Buyer | Sale Price | Title Company |
|---|---|---|---|
| Flores Jose M | -- | None Available | |
| Flores Jose M | -- | Wfg Title Company | |
| Flores Jose M | $323,000 | Wfg Title Company | |
| U S Bank National Association | $316,630 | Accommodation |
Source: Public Records
Mortgage History
| Date | Status | Borrower | Loan Amount |
|---|---|---|---|
| Previous Owner | Flores Jose M | $306,850 |
Source: Public Records
Tax History Compared to Growth
Tax History
| Year | Tax Paid | Tax Assessment Tax Assessment Total Assessment is a certain percentage of the fair market value that is determined by local assessors to be the total taxable value of land and additions on the property. | Land | Improvement |
|---|---|---|---|---|
| 2025 | $4,502 | $388,185 | $206,224 | $181,961 |
| 2024 | $4,502 | $380,575 | $202,181 | $178,394 |
| 2023 | $4,441 | $373,114 | $198,217 | $174,897 |
| 2022 | $4,314 | $365,799 | $194,331 | $171,468 |
| 2021 | $4,214 | $358,627 | $190,521 | $168,106 |
| 2020 | $4,114 | $354,951 | $188,568 | $166,383 |
| 2019 | $4,008 | $347,992 | $184,871 | $163,121 |
| 2018 | $3,946 | $341,170 | $181,247 | $159,923 |
| 2017 | $3,864 | $334,482 | $177,694 | $156,788 |
| 2016 | $3,774 | $327,924 | $174,210 | $153,714 |
| 2015 | $3,686 | $320,000 | $170,000 | $150,000 |
| 2014 | -- | $57,628 | $15,243 | $42,385 |
Source: Public Records
Map
Nearby Homes
- 3753 Coleman Ave
- 3672 Byrd St
- 3982 Palm Ave
- 4026 Coleman Ave
- 3971 Caseman Ave
- 3470 Robb Roy Place
- 935 Caleb Ct
- 3443 Alonquin Way
- 4205 Rene Dr
- 3206 Caminito Quixote
- 414 Palm Ave
- 3124 Caminito Quixote
- 4250 Lemonseed Dr
- 1011 Beyer Way Unit 32
- 321 Palm Ave
- 234 Date St
- 3474 Del Sol Blvd Unit C
- 3414 Del Sol Blvd Unit A
- 3340 Del Sol Blvd Unit 208
- 3340 Del Sol Blvd Unit 139
- 3796 Goodbody St
- 813 Givens St
- 772 Blackwood Dr
- 762 Blackwood Dr
- 782 Blackwood Dr
- 3786 Goodbody St
- 821 Givens St
- 752 Blackwood Dr
- 3831 Coleman Ave
- 792 Blackwood Dr
- 3821 Coleman Ave
- 3813 Coleman Ave
- 3793 Goodbody St
- 796 Blackwood Dr
- 829 Givens St
- 3778 Goodbody St
- 3783 Goodbody St
- 802 Blackwood Dr
- 3797 Coleman Ave
- 839 Givens St