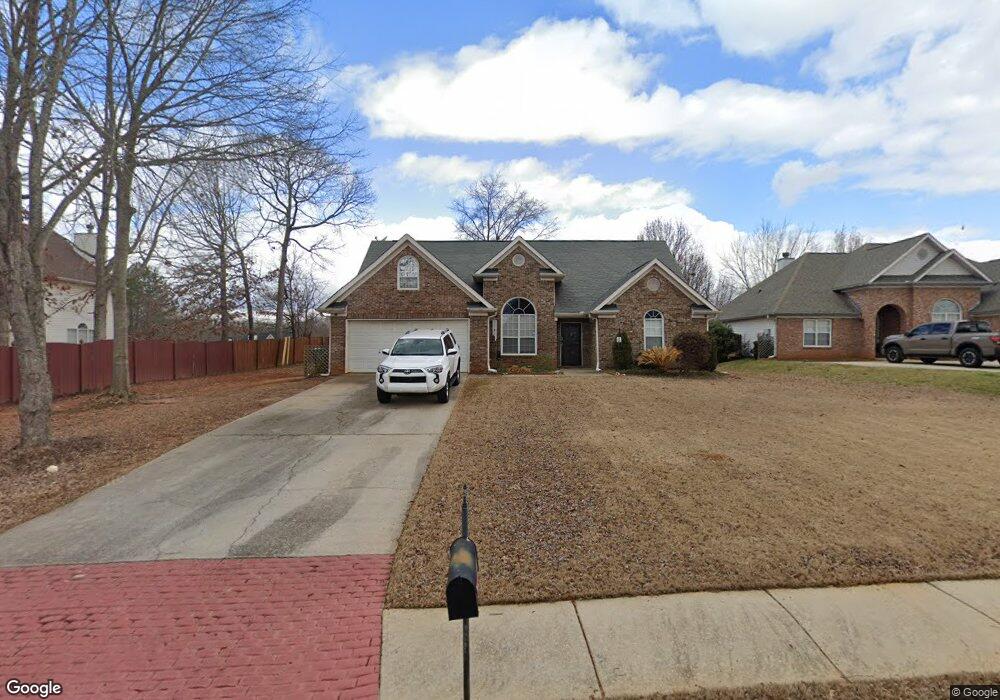
805 Glen Ivy Ct McDonough, GA 30253
Estimated Value: $307,510 - $358,000
3
Beds
2
Baths
1,926
Sq Ft
$170/Sq Ft
Est. Value
About This Home
This home is located at 805 Glen Ivy Ct, McDonough, GA 30253 and is currently estimated at $328,128, approximately $170 per square foot. 805 Glen Ivy Ct is a home located in Henry County with nearby schools including Luella Elementary School, Luella Middle School, and Luella High School.
Ownership History
Date
Name
Owned For
Owner Type
Purchase Details
Closed on
Dec 17, 2011
Sold by
Chu Kuo Wei
Bought by
Ward Markus R and Huynh Jason B
Current Estimated Value
Purchase Details
Closed on
Aug 1, 2011
Sold by
Woodcutter Properties Llc
Bought by
Chu Kuo Wei Chu
Home Financials for this Owner
Home Financials are based on the most recent Mortgage that was taken out on this home.
Original Mortgage
$107,211
Interest Rate
4.5%
Mortgage Type
FHA
Purchase Details
Closed on
Apr 29, 2011
Sold by
2006Rz2 Ramp
Bought by
Woodcutter Properties Llc
Purchase Details
Closed on
Jun 7, 2002
Sold by
Mnw Const Co
Bought by
West Barry W and West Connie
Home Financials for this Owner
Home Financials are based on the most recent Mortgage that was taken out on this home.
Original Mortgage
$162,000
Interest Rate
8.39%
Mortgage Type
New Conventional
Create a Home Valuation Report for This Property
The Home Valuation Report is an in-depth analysis detailing your home's value as well as a comparison with similar homes in the area
Home Values in the Area
Average Home Value in this Area
Purchase History
| Date | Buyer | Sale Price | Title Company |
|---|---|---|---|
| Ward Markus R | $111,000 | -- | |
| Chu Kuo Wei Chu | $111,000 | -- | |
| Woodcutter Properties Llc | $75,000 | -- | |
| West Barry W | -- | -- | |
| West Barry W | $162,000 | -- |
Source: Public Records
Mortgage History
| Date | Status | Borrower | Loan Amount |
|---|---|---|---|
| Previous Owner | Chu Kuo Wei Chu | $107,211 | |
| Previous Owner | West Barry W | $162,000 |
Source: Public Records
Tax History Compared to Growth
Tax History
| Year | Tax Paid | Tax Assessment Tax Assessment Total Assessment is a certain percentage of the fair market value that is determined by local assessors to be the total taxable value of land and additions on the property. | Land | Improvement |
|---|---|---|---|---|
| 2025 | $4,310 | $125,000 | $16,000 | $109,000 |
| 2024 | $4,310 | $125,920 | $16,000 | $109,920 |
| 2023 | $3,823 | $127,360 | $14,000 | $113,360 |
| 2022 | $4,038 | $103,320 | $14,000 | $89,320 |
| 2021 | $3,226 | $82,160 | $14,000 | $68,160 |
| 2020 | $3,071 | $78,120 | $10,000 | $68,120 |
| 2019 | $2,823 | $71,640 | $10,000 | $61,640 |
| 2018 | $2,720 | $68,960 | $11,200 | $57,760 |
| 2016 | $2,073 | $52,080 | $8,000 | $44,080 |
| 2015 | $2,139 | $52,400 | $8,000 | $44,400 |
| 2014 | $2,319 | $56,280 | $8,000 | $48,280 |
Source: Public Records
Map
Nearby Homes
- 1441 Trellis Ct
- 1441 Trellis Ct Unit (LOT 7)
- 461 Arbor Chase
- 1533 Rolling Meadows Dr
- 1313 Jubilee Ln
- 2200 Highway 20 W
- 400 Savannah Place
- 505 Stone Rd
- 2093 Parador Bend
- 276 Oakland Rd
- 112 Bridget Dr
- 1478 Elena Dr
- 272 Stone Rd
- 2026 Gates Ct
- 125 Bridget Dr
- 203 Nail Dr
- 133 Nail Dr
- 15 Oak Hill Ct
- 344 Williamsburg Cir Unit 1
- 1719 Highway 81 W
- 809 Glen Ivy Ct
- 809 Glen Ivy Ct Unit 1
- 801 Glen Ivy Ct Unit 1
- 0 Glen Ivy Ct Unit 8491345
- 800 Glen Ivy Ct
- 800 Glen Ivy Ct Unit 22
- 804 Glen Ivy Ct
- 1212 Ilex Ct
- 900 Ivy Brook Ct
- 1209 Ilex Ct
- 1101 Ligustrum Trail
- 810 Glen Ivy Ct Unit 1
- 184 Ivy Trace Unit 1
- 1208 Ilex Ct
- 819 Glen Ivy Ct
- 904 Ivy Brook Ct Unit 1
- 191 Ivy Trace
- 1121 Ligustrum Trail
- 178 Ivy Trace Unit 1
- 1204 Ilex Ct Unit 2