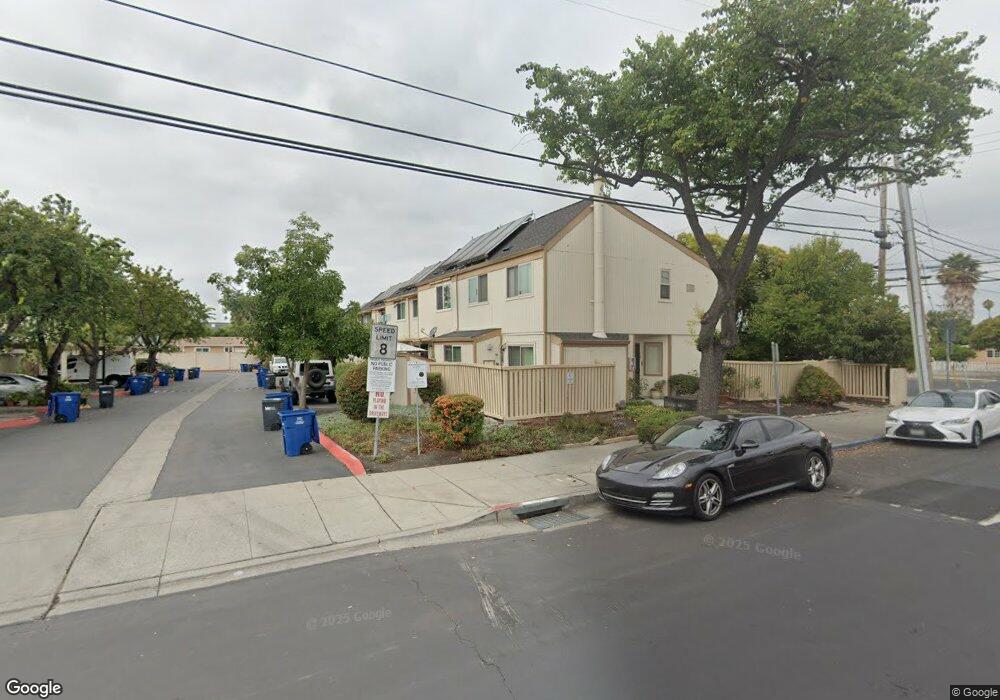
805 Island Pine Ct Hayward, CA 94544
Tennyson-Alquire NeighborhoodEstimated Value: $420,863 - $493,000
2
Beds
2
Baths
896
Sq Ft
$514/Sq Ft
Est. Value
About This Home
This home is located at 805 Island Pine Ct, Hayward, CA 94544 and is currently estimated at $460,216, approximately $513 per square foot. 805 Island Pine Ct is a home located in Alameda County with nearby schools including Ruus Elementary School, Cesar Chavez Middle School, and Tennyson High School.
Ownership History
Date
Name
Owned For
Owner Type
Purchase Details
Closed on
Jan 28, 2010
Sold by
Cana Jhackeline
Bought by
Ma Anna
Current Estimated Value
Purchase Details
Closed on
Oct 23, 2009
Sold by
Cana Jhackeline
Bought by
Homesales Inc
Purchase Details
Closed on
Jun 7, 2006
Sold by
Welch Erica
Bought by
Cana Jhackeline
Home Financials for this Owner
Home Financials are based on the most recent Mortgage that was taken out on this home.
Original Mortgage
$290,000
Interest Rate
5.87%
Mortgage Type
Purchase Money Mortgage
Purchase Details
Closed on
Jan 18, 2001
Sold by
Pavlas Michael A
Bought by
Welch Erica
Home Financials for this Owner
Home Financials are based on the most recent Mortgage that was taken out on this home.
Original Mortgage
$146,250
Interest Rate
7.87%
Purchase Details
Closed on
Mar 7, 1994
Sold by
Pavlas Michael A and Pavlas Mary E
Bought by
Pavlas Michael A
Home Financials for this Owner
Home Financials are based on the most recent Mortgage that was taken out on this home.
Original Mortgage
$78,000
Interest Rate
7%
Create a Home Valuation Report for This Property
The Home Valuation Report is an in-depth analysis detailing your home's value as well as a comparison with similar homes in the area
Home Values in the Area
Average Home Value in this Area
Purchase History
| Date | Buyer | Sale Price | Title Company |
|---|---|---|---|
| Ma Anna | $130,000 | Fidelity National Title Co | |
| Homesales Inc | $86,316 | Accommodation | |
| Cana Jhackeline | $365,000 | First American Title Co | |
| Welch Erica | $200,000 | American Title Co | |
| Pavlas Michael A | $39,000 | Chicago Title Company |
Source: Public Records
Mortgage History
| Date | Status | Borrower | Loan Amount |
|---|---|---|---|
| Previous Owner | Cana Jhackeline | $290,000 | |
| Previous Owner | Welch Erica | $146,250 | |
| Previous Owner | Pavlas Michael A | $78,000 | |
| Closed | Welch Erica | $48,750 |
Source: Public Records
Tax History
| Year | Tax Paid | Tax Assessment Tax Assessment Total Assessment is a certain percentage of the fair market value that is determined by local assessors to be the total taxable value of land and additions on the property. | Land | Improvement |
|---|---|---|---|---|
| 2025 | $2,326 | $167,794 | $50,338 | $117,456 |
| 2024 | $2,326 | $164,505 | $49,351 | $115,154 |
| 2023 | $2,294 | $161,280 | $48,384 | $112,896 |
| 2022 | $2,253 | $158,118 | $47,435 | $110,683 |
| 2021 | $2,235 | $155,018 | $46,505 | $108,513 |
| 2020 | $2,213 | $153,430 | $46,029 | $107,401 |
| 2019 | $2,228 | $150,422 | $45,126 | $105,296 |
| 2018 | $2,106 | $147,474 | $44,242 | $103,232 |
| 2017 | $2,064 | $144,583 | $43,375 | $101,208 |
| 2016 | $1,931 | $141,748 | $42,524 | $99,224 |
| 2015 | $1,897 | $139,620 | $41,886 | $97,734 |
| 2014 | $1,812 | $136,887 | $41,066 | $95,821 |
Source: Public Records
Map
Nearby Homes
- 27796 Vasona Ct Unit 2
- 27906 Thackeray Ave
- 27781 Dickens Ave
- 28538 Huntwood Ave
- 27505 Tampa Ave Unit 39
- 27777 Pistachio Ct
- 1177 Thiel Rd
- 27773 Pistachio Ct
- 28315 Rochelle Ave
- 139 Mars Ave Unit 139
- 761 Shepherd Ave
- 27720 Seminole Way
- 29026 Hillview St
- 29255 Harpoon Way
- 29131 Delgado Rd
- 1587 de Lemos Ave
- 994 Westwood St
- 26937 Huntwood Ave
- 29273 Nantucket Way
- 29133 De la Cruz Rd
- 807 Island Pine Ct
- 803 Island Pine Ct
- 809 Island Pine Ct
- 801 Island Pine Ct
- 811 Island Pine Ct
- 813 Island Pine Ct
- 815 Island Pine Ct
- 817 Island Pine Ct
- 804 Island Pine Ct
- 806 Island Pine Ct
- 810 Island Pine Ct
- 808 Island Pine Ct
- 802 Island Pine Ct
- 812 Island Pine Ct
- 795 795 Rock Rose Ct
- 795 Rock Rose Ct
- 814 Island Pine Ct
- 819 Island Pine Ct
- 816 Island Pine Ct
- 793 Rock Rose Ct
Your Personal Tour Guide
Ask me questions while you tour the home.