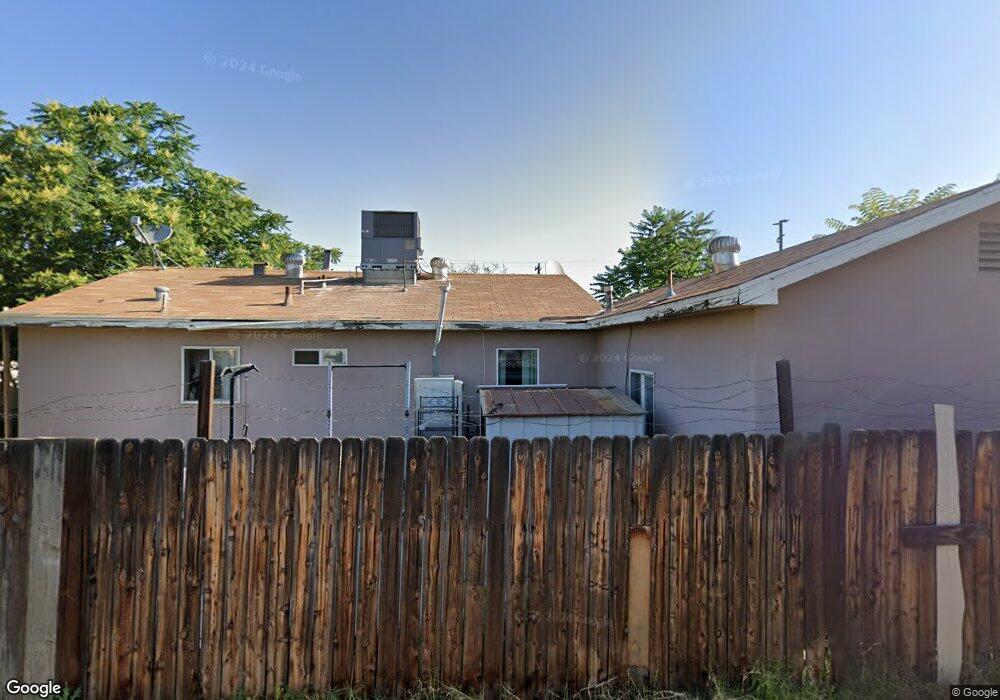
805 Ming Ave Bakersfield, CA 93307
Southgate NeighborhoodEstimated Value: $220,295 - $260,000
2
Beds
1
Bath
775
Sq Ft
$309/Sq Ft
Est. Value
About This Home
This home is located at 805 Ming Ave, Bakersfield, CA 93307 and is currently estimated at $239,574, approximately $309 per square foot. 805 Ming Ave is a home located in Kern County with nearby schools including Wayside Elementary School, Sequoia Middle School, and South High School.
Ownership History
Date
Name
Owned For
Owner Type
Purchase Details
Closed on
Jun 24, 2005
Sold by
Galvan Samuel
Bought by
Islamic Center Of San Joaquin Valley
Current Estimated Value
Purchase Details
Closed on
Dec 18, 2000
Sold by
Galvan Manuela
Bought by
Galvan Samuel
Home Financials for this Owner
Home Financials are based on the most recent Mortgage that was taken out on this home.
Original Mortgage
$42,000
Interest Rate
7.81%
Purchase Details
Closed on
Mar 3, 1998
Sold by
Cook Daiel Bragg
Bought by
Galvan Samuel and Galvan Manuela
Purchase Details
Closed on
Jan 6, 1998
Sold by
Dan Cook Inc Inc
Bought by
Cook Daniel Bragg
Create a Home Valuation Report for This Property
The Home Valuation Report is an in-depth analysis detailing your home's value as well as a comparison with similar homes in the area
Home Values in the Area
Average Home Value in this Area
Purchase History
| Date | Buyer | Sale Price | Title Company |
|---|---|---|---|
| Islamic Center Of San Joaquin Valley | $190,000 | Stewart Title | |
| Galvan Samuel | -- | Stewart Title | |
| Galvan Samuel | -- | -- | |
| Cook Daniel Bragg | $41,796 | Commonwealth Land Title Ins |
Source: Public Records
Mortgage History
| Date | Status | Borrower | Loan Amount |
|---|---|---|---|
| Previous Owner | Galvan Samuel | $42,000 |
Source: Public Records
Tax History
| Year | Tax Paid | Tax Assessment Tax Assessment Total Assessment is a certain percentage of the fair market value that is determined by local assessors to be the total taxable value of land and additions on the property. | Land | Improvement |
|---|---|---|---|---|
| 2025 | $3,191 | $211,000 | $55,000 | $156,000 |
| 2024 | $3,236 | $193,000 | $48,000 | $145,000 |
| 2023 | $3,236 | $200,000 | $50,000 | $150,000 |
| 2022 | $2,785 | $167,000 | $42,000 | $125,000 |
| 2021 | $2,561 | $154,000 | $39,000 | $115,000 |
| 2020 | $2,168 | $123,000 | $31,000 | $92,000 |
| 2019 | $1,997 | $112,000 | $28,000 | $84,000 |
| 2018 | $1,682 | $88,000 | $22,000 | $66,000 |
| 2017 | $1,696 | $89,000 | $22,000 | $67,000 |
| 2016 | $1,314 | $73,000 | $18,000 | $55,000 |
| 2015 | $1,280 | $69,000 | $17,000 | $52,000 |
| 2014 | $961 | $42,000 | $11,000 | $31,000 |
Source: Public Records
Map
Nearby Homes
- 1901 Sunshine Ave
- 904 Curtis Dr
- 1904 Sunshine Ave
- 600 Lawson Rd
- 1021 Ming Ave
- 808 Southgate Dr
- 500 Lawson Rd
- 1017 Curtis Dr
- 407 Vine Dr
- 410 Curtis Dr
- 2124 Mahoney St
- 1108 Southgate Dr
- 2120 S M St
- 1312 Ming Ave
- 1410 Southgate Dr
- 1917 S J St
- 1512 Southgate Dr
- 1405 S Chester Ave
- 2612 Lee Dr
- 2612 S Chester Ave
Your Personal Tour Guide
Ask me questions while you tour the home.