805 N Piute Ave Independence, MO 64056
Randall NeighborhoodEstimated Value: $264,000 - $305,000
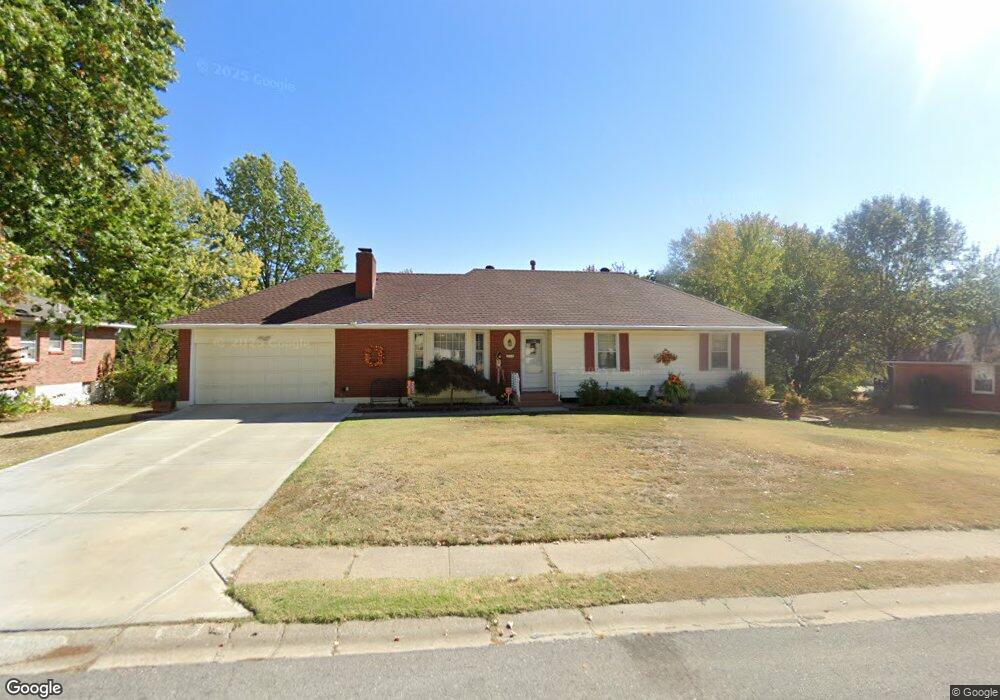
About This Home
This home is located at 805 N Piute Ave, Independence, MO 64056 and is currently estimated at $282,828, approximately $177 per square foot. 805 N Piute Ave is a home located in Jackson County with nearby schools including Randall Elementary School, Bridger Middle School, and Bingham Middle School.
Ownership History
We collect this data history from publicly available records. To have your information removed, we recommend requesting removal directly through your county’s website.
Purchase Details
Purchase Details
Home Financials for this Owner
Home Financials are based on the most recent Mortgage that was taken out on this home.Purchase Details
Purchase Details
Home Values in the Area
Average Home Value in this Area
Purchase History
We collect this data history from publicly available records. To have your information removed, we recommend requesting removal directly through your county’s website.
| Date | Buyer | Sale Price | Title Company |
|---|---|---|---|
| -- | None Available | ||
| -- | Stewart Title | ||
| -- | Assured Quality Title Co | ||
| -- | -- |
Mortgage History
We collect this data history from publicly available records. To have your information removed, we recommend requesting removal directly through your county’s website.
| Date | Status | Borrower | Loan Amount |
|---|---|---|---|
| Closed | $56,000 |
Tax History
We collect this data history from publicly available records. To have your information removed, we recommend requesting removal directly through your county’s website.
| Year | Tax Paid | Tax Assessment Tax Assessment Total Assessment is a certain percentage of the fair market value that is determined by local assessors to be the total taxable value of land and additions on the property. | Land | Improvement |
|---|---|---|---|---|
| 2025 | $3,429 | $35,430 | $5,860 | $29,570 |
| 2024 | $3,351 | $49,495 | $5,605 | $43,890 |
| 2023 | $3,351 | $49,496 | $4,570 | $44,926 |
| 2022 | $1,979 | $26,790 | $4,893 | $21,897 |
| 2021 | $1,978 | $26,790 | $4,893 | $21,897 |
| 2020 | $1,813 | $23,860 | $4,893 | $18,967 |
| 2019 | $1,784 | $23,860 | $4,893 | $18,967 |
| 2018 | $1,848 | $23,596 | $5,061 | $18,535 |
| 2017 | $1,848 | $23,596 | $5,061 | $18,535 |
| 2016 | $1,820 | $23,005 | $3,914 | $19,091 |
| 2014 | $1,728 | $22,335 | $3,800 | $18,535 |
Map
- 17830 E Bundschu Rd
- 17908 E Cheyenne Dr
- 1102 N Farview Dr
- 18001 E 12th St N
- 18699 E Bundschu Rd
- 1211 N Cedar Crest Dr
- 18602 E 6th St N
- 18505 E 5th St N
- 914 N Arrowhead Dr
- 406 N Geronimo Dr
- 19221 E 5th Terrace N
- 17301 E Kentucky Rd
- 18317 E 24 Highway Cir
- 1313 N Cedar Crest Dr
- 1044 Arrowhead Ridge
- 313 N Geronimo Dr
- 18900 E 6th St N
- 317 N Cochise Dr
- 18611 E Salisbury Rd
- 513 N Powahatan Dr
- 807 N Piute Ave
- 809 N Piute Ave
- 804 N Ute St
- 808 N Piute Ave
- 806 N Piute Ave
- 811 N Piute Ave
- 17804 E Redwood Dr
- 810 N Piute Ave
- 804 N Piute Ave
- 800 N Ute St
- 806 N Ute St
- 801 N Piute Ave
- 802 N Piute Ave
- 812 N Piute Ave
- 813 N Piute Ave
- 808 N Ute St
- 803 N Ute St
- 805 N Ute St
- 821 N Apache Dr
- 819 N Apache Dr
Ask me questions while you tour the home.