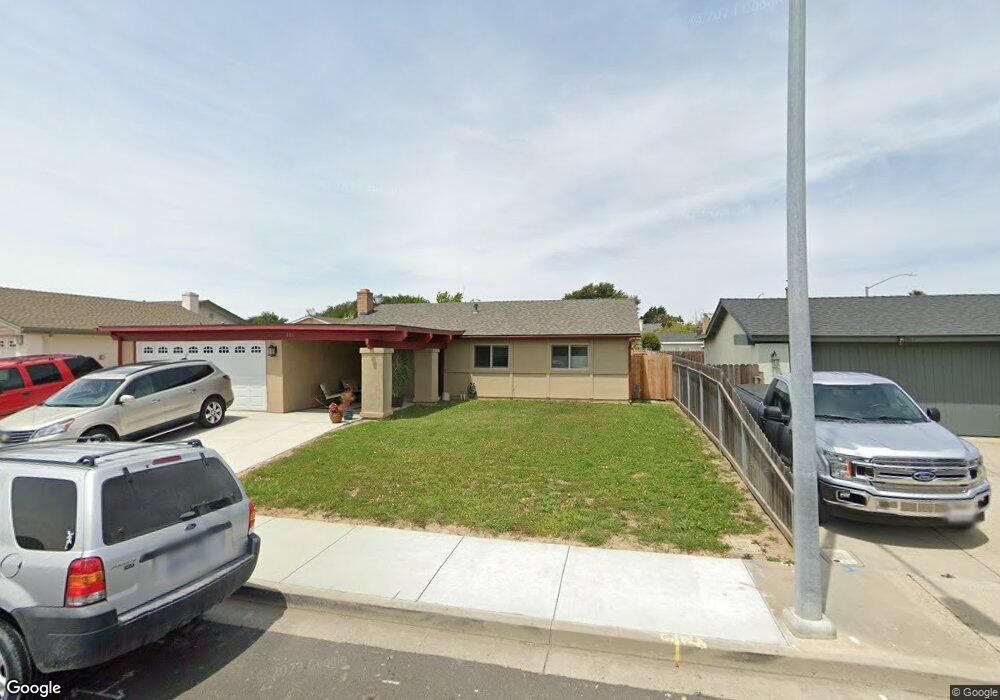
805 Northpoint Place Lompoc, CA 93436
West Lompoc NeighborhoodEstimated Value: $526,552 - $679,000
3
Beds
2
Baths
1,280
Sq Ft
$452/Sq Ft
Est. Value
About This Home
This home is located at 805 Northpoint Place, Lompoc, CA 93436 and is currently estimated at $578,638, approximately $452 per square foot. 805 Northpoint Place is a home located in Santa Barbara County with nearby schools including La Canada Elementary School, Lompoc Valley Middle School, and Lompoc High School.
Ownership History
Date
Name
Owned For
Owner Type
Purchase Details
Closed on
Sep 16, 2020
Sold by
Pueschel Robert B and Pueschel Rose M
Bought by
Watson Keith D and Watson Gloria J
Current Estimated Value
Home Financials for this Owner
Home Financials are based on the most recent Mortgage that was taken out on this home.
Original Mortgage
$270,000
Outstanding Balance
$239,163
Interest Rate
2.8%
Mortgage Type
New Conventional
Estimated Equity
$339,475
Purchase Details
Closed on
May 7, 2014
Sold by
Pueschel Robert B and Pueschel Rose M
Bought by
Pueschel Family Trust and Pueschel Rose M
Purchase Details
Closed on
Jun 14, 1999
Sold by
Kahlid Mahmood
Bought by
Pueschel Robert B and Pueschel Rose M
Purchase Details
Closed on
Dec 3, 1997
Sold by
Mahmood Kahlid
Bought by
Mahmood Kahlid and Mahmood Ruth
Create a Home Valuation Report for This Property
The Home Valuation Report is an in-depth analysis detailing your home's value as well as a comparison with similar homes in the area
Home Values in the Area
Average Home Value in this Area
Purchase History
| Date | Buyer | Sale Price | Title Company |
|---|---|---|---|
| Watson Keith D | $370,000 | Fidelity National Title Co | |
| Pueschel Family Trust | -- | None Available | |
| Pueschel Robert B | -- | None Available | |
| Pueschel Robert B | -- | -- | |
| Mahmood Kahlid | -- | First American Title |
Source: Public Records
Mortgage History
| Date | Status | Borrower | Loan Amount |
|---|---|---|---|
| Open | Watson Keith D | $270,000 |
Source: Public Records
Tax History Compared to Growth
Tax History
| Year | Tax Paid | Tax Assessment Tax Assessment Total Assessment is a certain percentage of the fair market value that is determined by local assessors to be the total taxable value of land and additions on the property. | Land | Improvement |
|---|---|---|---|---|
| 2025 | $4,368 | $400,498 | $119,066 | $281,432 |
| 2023 | $4,368 | $384,948 | $114,444 | $270,504 |
| 2022 | $4,293 | $377,400 | $112,200 | $265,200 |
| 2021 | $4,341 | $370,000 | $110,000 | $260,000 |
| 2020 | $2,164 | $182,481 | $72,991 | $109,490 |
| 2019 | $2,128 | $178,904 | $71,560 | $107,344 |
| 2018 | $2,095 | $175,397 | $70,157 | $105,240 |
| 2017 | $2,056 | $171,959 | $68,782 | $103,177 |
| 2016 | $2,019 | $168,588 | $67,434 | $101,154 |
| 2015 | $2,004 | $166,057 | $66,422 | $99,635 |
| 2014 | $1,976 | $162,805 | $65,121 | $97,684 |
Source: Public Records
Map
Nearby Homes
- 1265 Stonebrook Dr
- 1241 Stonebrook Dr
- 1320 Stonebrook Dr
- 1121 Bellflower Ln
- 1236 Jason Dr
- 906 N P St
- 321 W North Ave Unit 49
- 1429 Glen Ellen Ln
- 905 N L St
- 816 N O St Unit 113
- 1407 N H St
- 1317 N V St Unit 182
- 1317 N V St Unit 76
- 100 California 1
- 1212 W Prune Ave
- 531 N O St
- 1006 Tranquillion Ct
- 1104 Honda Way
- 1209 N B St
- 413 E Oak Ave
- 809 Northpoint Place
- 801 Northpoint Place
- 804 W Barton Ave
- 800 W Barton Ave
- 808 W Barton Ave
- 813 Northpoint Place
- 804 Northpoint Place
- 808 Northpoint Place
- 812 W Barton Ave
- 901 Northpoint Place
- 812 Northpoint Place
- 1200 Primrose Ct
- 900 Northpoint Place
- 1201 Primrose Ct
- 905 Northpoint Place
- 728 Summerwood Ln
- 724 Summerwood Ln
- 1204 Primrose Ct