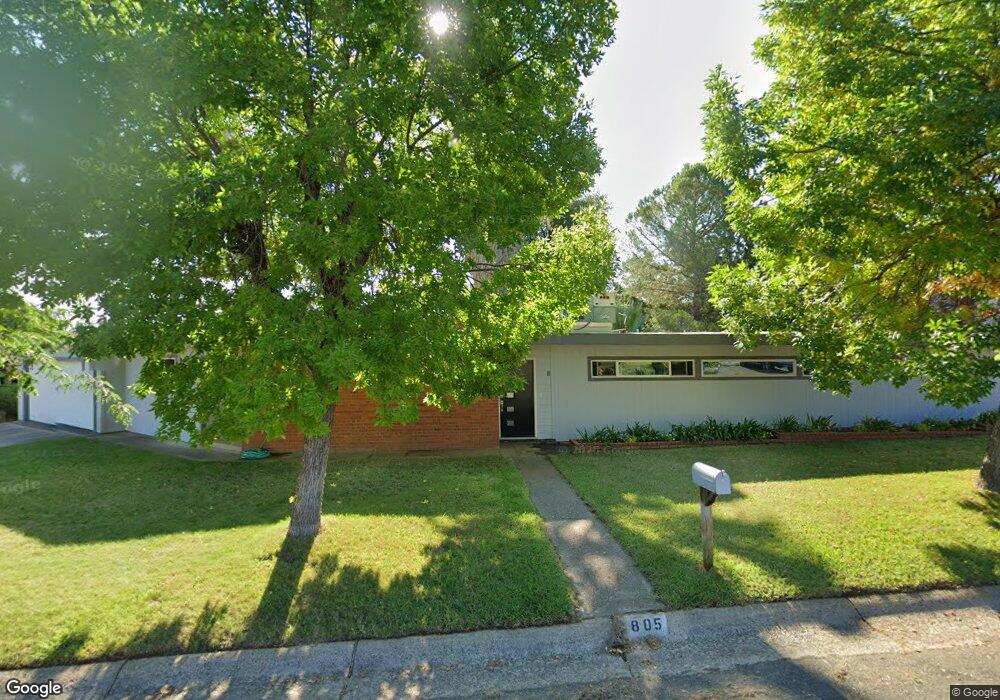
805 Overhill Dr Redding, CA 96001
Lakeview NeighborhoodEstimated Value: $348,324 - $456,000
3
Beds
2
Baths
1,800
Sq Ft
$226/Sq Ft
Est. Value
About This Home
This home is located at 805 Overhill Dr, Redding, CA 96001 and is currently estimated at $407,581, approximately $226 per square foot. 805 Overhill Dr is a home located in Shasta County with nearby schools including Manzanita Elementary School, Sequoia Middle School, and Shasta High School.
Ownership History
Date
Name
Owned For
Owner Type
Purchase Details
Closed on
Mar 19, 2020
Sold by
Westphal William F
Bought by
Westphal William F and Westphal William F
Current Estimated Value
Purchase Details
Closed on
Aug 24, 2015
Sold by
Glass Susan A
Bought by
Westphal William F
Purchase Details
Closed on
Jun 28, 2007
Sold by
Westphal William F
Bought by
Glass Susan A and Westphal William F
Purchase Details
Closed on
Apr 16, 2007
Sold by
Westphal William F
Bought by
Westphal William
Home Financials for this Owner
Home Financials are based on the most recent Mortgage that was taken out on this home.
Original Mortgage
$93,999
Interest Rate
6.1%
Mortgage Type
Credit Line Revolving
Purchase Details
Closed on
Apr 9, 2002
Sold by
Westphal Sharon A
Bought by
Westphal William F
Home Financials for this Owner
Home Financials are based on the most recent Mortgage that was taken out on this home.
Original Mortgage
$127,000
Interest Rate
6.78%
Create a Home Valuation Report for This Property
The Home Valuation Report is an in-depth analysis detailing your home's value as well as a comparison with similar homes in the area
Home Values in the Area
Average Home Value in this Area
Purchase History
| Date | Buyer | Sale Price | Title Company |
|---|---|---|---|
| Westphal William F | -- | None Available | |
| Westphal William F | -- | None Available | |
| Glass Susan A | -- | None Available | |
| Westphal William | -- | Chicago Title Co | |
| Westphal William F | -- | Placer Title Company |
Source: Public Records
Mortgage History
| Date | Status | Borrower | Loan Amount |
|---|---|---|---|
| Previous Owner | Westphal William | $93,999 | |
| Previous Owner | Westphal William | $94,000 | |
| Previous Owner | Westphal William F | $127,000 |
Source: Public Records
Tax History
| Year | Tax Paid | Tax Assessment Tax Assessment Total Assessment is a certain percentage of the fair market value that is determined by local assessors to be the total taxable value of land and additions on the property. | Land | Improvement |
|---|---|---|---|---|
| 2025 | $2,130 | $211,466 | $60,657 | $150,809 |
| 2024 | $2,096 | $207,320 | $59,468 | $147,852 |
| 2023 | $2,096 | $203,255 | $58,302 | $144,953 |
| 2022 | $2,059 | $199,270 | $57,159 | $142,111 |
| 2021 | $2,047 | $195,364 | $56,039 | $139,325 |
| 2020 | $2,074 | $193,362 | $55,465 | $137,897 |
| 2019 | $1,967 | $189,572 | $54,378 | $135,194 |
| 2018 | $1,983 | $185,856 | $53,312 | $132,544 |
| 2017 | $1,971 | $182,213 | $52,267 | $129,946 |
| 2016 | $1,907 | $178,642 | $51,243 | $127,399 |
| 2015 | $1,882 | $175,960 | $50,474 | $125,486 |
| 2014 | $1,868 | $172,514 | $49,486 | $123,028 |
Source: Public Records
Map
Nearby Homes
- 1025 Chardonnay Walk
- 582 River Oaks Dr
- 531 Aurora Place
- 3330 Scenic Dr
- 866 Palatine Ct
- 802 Palatine Ct
- 1191 Hillcrest Place
- 3510 Eureka Way
- 2565 North St
- 1355 Bambury Ct
- 3345 Oakwood Place
- 1163 Sunriver Ln
- Lot 15 N Ridge Dr
- 920 Hallmark Dr
- 910 Hallmark Dr
- 418 Moonstone Way
- 962 Leisha Ln
- 1569 Walnut Ave
- 2315 Butte St
- 1545 Olive Ave
- 755 Cascade Ct
- 815 Overhill Dr
- 810 Overhill Dr
- 745 Cascade Ct
- 820 Overhill Dr
- 825 Overhill Dr
- 2930 Pioneer Dr
- 800 Overhill Dr
- 830 Overhill Dr
- 740 Overhill Dr
- 705 Cascade Ct
- 735 Cascade Ct
- 2910 Pioneer Dr
- 835 Overhill Dr
- 840 Overhill Dr
- 720 Overhill Dr
- 700 Overhill Dr Unit 1
- 700 Overhill Dr
- 2900 Pioneer Dr
- 725 Cascade Ct
Your Personal Tour Guide
Ask me questions while you tour the home.