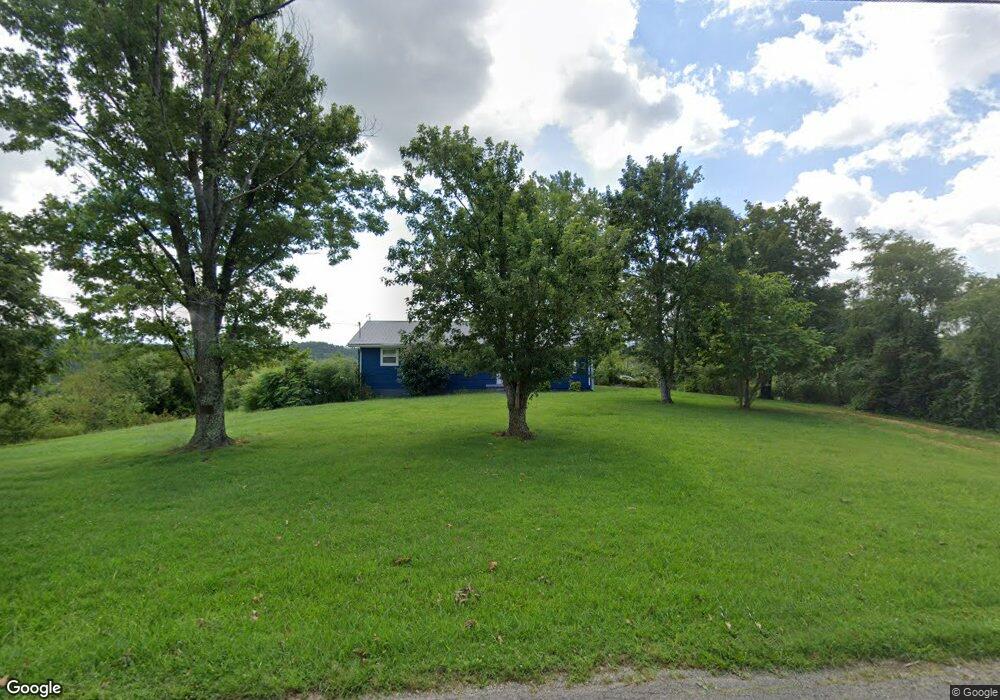
805 Pates Hill Rd Mosheim, TN 37818
Estimated Value: $171,000 - $277,000
3
Beds
2
Baths
1,288
Sq Ft
$167/Sq Ft
Est. Value
About This Home
This home is located at 805 Pates Hill Rd, Mosheim, TN 37818 and is currently estimated at $215,625, approximately $167 per square foot. 805 Pates Hill Rd is a home located in Greene County with nearby schools including Nolachuckey Elementary School, South Greene Middle School, and South Greene High School.
Ownership History
Date
Name
Owned For
Owner Type
Purchase Details
Closed on
Apr 30, 2018
Sold by
Nohejl James W and Noehejl Janet M
Bought by
Barnard Kayla Alice and Barnard Bradley
Current Estimated Value
Home Financials for this Owner
Home Financials are based on the most recent Mortgage that was taken out on this home.
Original Mortgage
$28,000
Outstanding Balance
$21,052
Interest Rate
5.5%
Mortgage Type
Adjustable Rate Mortgage/ARM
Estimated Equity
$194,573
Purchase Details
Closed on
Jul 12, 2011
Sold by
Gray Pauline
Bought by
White Vickie A
Home Financials for this Owner
Home Financials are based on the most recent Mortgage that was taken out on this home.
Original Mortgage
$86,557
Interest Rate
4.5%
Mortgage Type
FHA
Purchase Details
Closed on
Mar 6, 2007
Sold by
Gray Jerry
Bought by
Gray Jerry
Purchase Details
Closed on
Mar 2, 2007
Sold by
Gray Jerry
Bought by
Gray Pauline
Create a Home Valuation Report for This Property
The Home Valuation Report is an in-depth analysis detailing your home's value as well as a comparison with similar homes in the area
Home Values in the Area
Average Home Value in this Area
Purchase History
| Date | Buyer | Sale Price | Title Company |
|---|---|---|---|
| Barnard Kayla Alice | $35,000 | Reliable Title & Escrow Llc | |
| White Vickie A | $92,000 | -- | |
| Gray Jerry | -- | -- | |
| Gray Pauline | -- | -- |
Source: Public Records
Mortgage History
| Date | Status | Borrower | Loan Amount |
|---|---|---|---|
| Open | Barnard Kayla Alice | $28,000 | |
| Previous Owner | White Vickie A | $86,557 |
Source: Public Records
Tax History Compared to Growth
Tax History
| Year | Tax Paid | Tax Assessment Tax Assessment Total Assessment is a certain percentage of the fair market value that is determined by local assessors to be the total taxable value of land and additions on the property. | Land | Improvement |
|---|---|---|---|---|
| 2024 | $573 | $34,700 | $4,125 | $30,575 |
| 2023 | $573 | $34,700 | $0 | $0 |
| 2022 | $41,500 | $20,600 | $2,875 | $17,725 |
| 2021 | $415 | $20,600 | $2,875 | $17,725 |
| 2020 | $415 | $20,600 | $2,875 | $17,725 |
| 2019 | $415 | $20,600 | $2,875 | $17,725 |
| 2018 | $415 | $20,600 | $2,875 | $17,725 |
| 2017 | $401 | $20,325 | $2,875 | $17,450 |
| 2016 | $381 | $20,325 | $2,875 | $17,450 |
| 2015 | $381 | $20,325 | $2,875 | $17,450 |
| 2014 | $381 | $20,325 | $2,875 | $17,450 |
Source: Public Records
Map
Nearby Homes
- 875 Pates Hill Rd
- 640 Pates Hill Rd
- 485 Pates Hill Rd
- 7680 Warrensburg Rd
- 55 Little Chuckey Cutoff
- 8300 Warrensburg Rd
- Lot 1-2 Pates Hill Rd
- 780 Bright Hope Rd
- 2.74 Acres Bright Hope Rd
- Lot 8 Little Chuckey Rd
- 1331 Bright Hope Rd
- 9915 Warrensburg Rd
- 1 Pates Hill
- 1005 Jackson Hollow Rd
- TBD Poplar Springs Rd
- 1633 Poplar Springs Rd
- 120 Valley View Rd
- 1410 Timber Ridge Rd
- 1200 Jackson Hollow Rd
- 241 E Stagecoach Rd
- 765 Pates Hill Rd
- 805 Pates Hill Rd
- 825 Pates Hill Rd
- 800 Pates Hill Rd
- 705 Pates Hill Rd
- 720 Pates Hill Rd
- 280 Snake Hollow Rd
- 655 Pates Hill Rd
- 905 Old Lane Rd
- 945 Pates Hill Rd
- 670 Pates Hill Rd
- 585 Pates Hill Rd
- 590 Pates Hill Rd
- 1000 Pates Hill Rd
- 815 Old Lane Rd
- 560 Pates Hill Rd
- 000 Pates Hill Rd
- 700 Snake Hollow Rd
- 520 Pates Hill Rd
- 1065 Pates Hill Rd