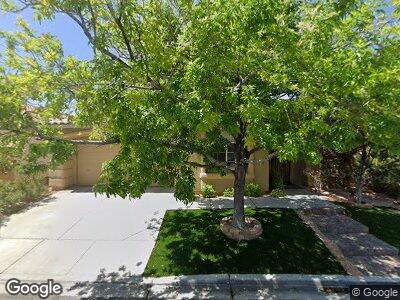
805 Royal Elm Ln Unit 2 Las Vegas, NV 89144
Summerlin NeighborhoodEstimated Value: $544,000 - $585,000
3
Beds
2
Baths
1,987
Sq Ft
$286/Sq Ft
Est. Value
About This Home
This home is located at 805 Royal Elm Ln Unit 2, Las Vegas, NV 89144 and is currently estimated at $568,530, approximately $286 per square foot. 805 Royal Elm Ln Unit 2 is a home located in Clark County with nearby schools including John W. Bonner Elementary School, Sig Rogich Middle School, and Palo Verde High School.
Ownership History
Date
Name
Owned For
Owner Type
Purchase Details
Closed on
Oct 19, 2001
Sold by
Morrow Lillian C and Morrow Brook S
Bought by
Villanueva Don C and Villanueva Mary A
Current Estimated Value
Home Financials for this Owner
Home Financials are based on the most recent Mortgage that was taken out on this home.
Original Mortgage
$164,000
Interest Rate
6.87%
Purchase Details
Closed on
Nov 23, 1998
Sold by
The Presley Homes
Bought by
Morrow Brook S and Morrow Lillian C
Home Financials for this Owner
Home Financials are based on the most recent Mortgage that was taken out on this home.
Original Mortgage
$166,056
Interest Rate
6.42%
Mortgage Type
VA
Create a Home Valuation Report for This Property
The Home Valuation Report is an in-depth analysis detailing your home's value as well as a comparison with similar homes in the area
Home Values in the Area
Average Home Value in this Area
Purchase History
| Date | Buyer | Sale Price | Title Company |
|---|---|---|---|
| Villanueva Don C | $205,000 | United Title | |
| Morrow Brook S | $166,000 | First American Title Co |
Source: Public Records
Mortgage History
| Date | Status | Borrower | Loan Amount |
|---|---|---|---|
| Open | Villanueva Mary A | $120,000 | |
| Closed | Villanueva Don C | $145,700 | |
| Closed | Villanueva Don C | $50,000 | |
| Closed | Villanueva Don C | $164,000 | |
| Previous Owner | Morrow Brook S | $166,056 |
Source: Public Records
Tax History Compared to Growth
Tax History
| Year | Tax Paid | Tax Assessment Tax Assessment Total Assessment is a certain percentage of the fair market value that is determined by local assessors to be the total taxable value of land and additions on the property. | Land | Improvement |
|---|---|---|---|---|
| 2025 | $2,661 | $133,038 | $59,850 | $73,188 |
| 2024 | $2,584 | $133,038 | $59,850 | $73,188 |
| 2023 | $2,584 | $114,965 | $45,500 | $69,465 |
| 2022 | $2,509 | $101,723 | $38,150 | $63,573 |
| 2021 | $2,436 | $96,630 | $36,050 | $60,580 |
| 2020 | $2,362 | $91,963 | $31,850 | $60,113 |
| 2019 | $2,293 | $89,954 | $30,800 | $59,154 |
| 2018 | $2,252 | $80,099 | $23,100 | $56,999 |
| 2017 | $2,605 | $79,282 | $21,700 | $57,582 |
| 2016 | $2,108 | $77,090 | $19,250 | $57,840 |
| 2015 | $2,104 | $71,114 | $14,000 | $57,114 |
| 2014 | $2,042 | $60,233 | $11,025 | $49,208 |
Source: Public Records
Map
Nearby Homes
- 10540 Beachwalk Place
- 10404 Shadowland Ave
- 428 Copper Valley Ct
- 10657 Blue Nile Ct
- 10717 Beringer Dr
- 10680 Sapphire Vista Ave
- 1201 Mersault Ct
- 812 Eaglewood Dr
- 1024 Eaglewood Dr
- 10657 Sapphire Vista Ave
- 432 Emerald Heights St
- 10400 Beachwalk Place
- 1200 Dry Point Ct
- 340 Autumn Palace Ct
- 428 Madison Taylor Place
- 417 Carlton Kay Place
- 1309 Reisling Ct
- 10241 Regents Cross Place
- 1212 Muscato Ct
- 10601 Turquoise Valley Dr
- 805 Royal Elm Ln Unit 2
- 809 Royal Elm Ln
- 801 Royal Elm Ln
- 808 Royal Birch Ln
- 804 Royal Birch Ln
- 812 Royal Birch Ln
- 804 Royal Elm Ln
- 816 Royal Birch Ln
- 800 Royal Elm Ln
- 817 Royal Elm Ln
- 808 Royal Elm Ln
- 10629 Redwood Grove Ave
- 10633 Redwood Grove Ave Unit 3
- 812 Royal Elm Ln
- 10625 Redwood Grove Ave
- 10625 Redwood Grove Ave Unit n/a
- 820 Royal Birch Ln
- 10637 Redwood Grove Ave
- 821 Royal Elm Ln
- 10621 Redwood Grove Ave