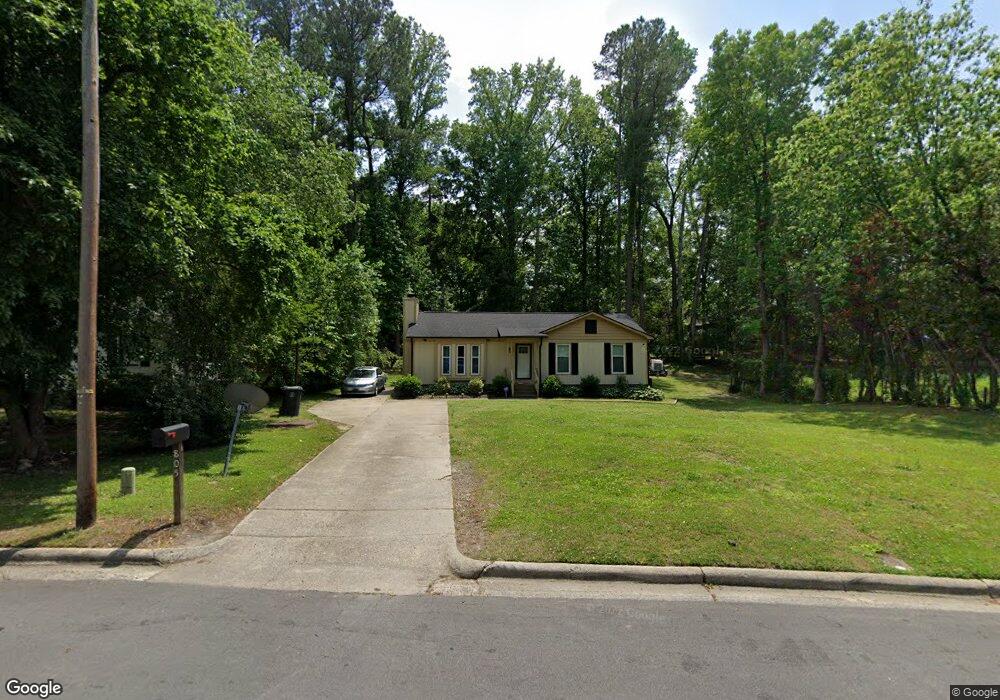
805 Springview Trail Garner, NC 27529
Estimated Value: $299,000 - $320,000
3
Beds
2
Baths
1,373
Sq Ft
$224/Sq Ft
Est. Value
About This Home
This home is located at 805 Springview Trail, Garner, NC 27529 and is currently estimated at $307,788, approximately $224 per square foot. 805 Springview Trail is a home located in Wake County with nearby schools including Vandora Springs Elementary, North Garner Middle, and Garner High.
Ownership History
Date
Name
Owned For
Owner Type
Purchase Details
Closed on
Jan 14, 2020
Sold by
Rivera Roberto Daniel
Bought by
Cameron Edgar Christopher
Current Estimated Value
Home Financials for this Owner
Home Financials are based on the most recent Mortgage that was taken out on this home.
Original Mortgage
$185,000
Interest Rate
3.73%
Mortgage Type
New Conventional
Purchase Details
Closed on
Sep 21, 2007
Sold by
Rivera Roberto and Rivera Joann
Bought by
Rivera Roberto Daniel
Home Financials for this Owner
Home Financials are based on the most recent Mortgage that was taken out on this home.
Original Mortgage
$116,000
Interest Rate
6.55%
Mortgage Type
Purchase Money Mortgage
Purchase Details
Closed on
Dec 22, 1997
Sold by
Rivera Joann
Bought by
Rivera Roberto and Rivera Jo Ann
Create a Home Valuation Report for This Property
The Home Valuation Report is an in-depth analysis detailing your home's value as well as a comparison with similar homes in the area
Home Values in the Area
Average Home Value in this Area
Purchase History
| Date | Buyer | Sale Price | Title Company |
|---|---|---|---|
| Cameron Edgar Christopher | $183,000 | None Listed On Document | |
| Cameron Edgar Christopher | $183,000 | None Available | |
| Rivera Roberto Daniel | $116,000 | None Available | |
| Rivera Roberto | -- | -- |
Source: Public Records
Mortgage History
| Date | Status | Borrower | Loan Amount |
|---|---|---|---|
| Previous Owner | Cameron Edgar Christopher | $185,000 | |
| Previous Owner | Rivera Roberto Daniel | $116,000 |
Source: Public Records
Tax History
| Year | Tax Paid | Tax Assessment Tax Assessment Total Assessment is a certain percentage of the fair market value that is determined by local assessors to be the total taxable value of land and additions on the property. | Land | Improvement |
|---|---|---|---|---|
| 2025 | $3,172 | $303,949 | $120,000 | $183,949 |
| 2024 | $3,161 | $303,949 | $120,000 | $183,949 |
Source: Public Records
Map
Nearby Homes
- 507 Forest Ridge Rd
- 617 Springview Trail
- 500 Oak Reserve Dr Unit 103
- 500 Oak Reserve Dr Unit 102
- 500 Oak Reserve Dr Unit 100
- 1710 Lakeside Dr
- 1416 Old Buckhorn Rd
- 1016 Buckhorn Rd
- 1201 Poplar Ave
- 902 Vandora Ave
- 109 Hiddenwood Ct
- 1320 W Garner Rd Unit 100
- 1320 W Garner Rd Unit 103
- 1320 W Garner Rd Unit 102
- 1320 W Garner Rd Unit 101
- 1209 Highland Rd
- 500 Oak Reserve Rd Unit 103
- 500 Oak Reserve Rd Unit 102
- 500 Oak Reserve Rd Unit 100
- 0 Dupree St
- 803 Springview Trail
- 109 Glenn Meadow Ct
- 111 Glenn Meadow Ct
- 801 Springview Trail
- 811 Springview Trail
- 802 Springview Trail
- 804 Springview Trail
- 107 Glenn Meadow Ct
- 800 Springview Trail
- 709 Springview Trail
- 901 Springview Trail
- 112 Glenn Meadow Ct
- 105 Glenn Meadow Ct
- 102 Glenview Ct
- 103 Brookstone Ct
- 103 Glen Meadow Ct
- 900 Springview Trail
- 707 Springview Trail
- 103 Glenn Meadow Ct
- 103 Glenn Meadow Ct
Your Personal Tour Guide
Ask me questions while you tour the home.