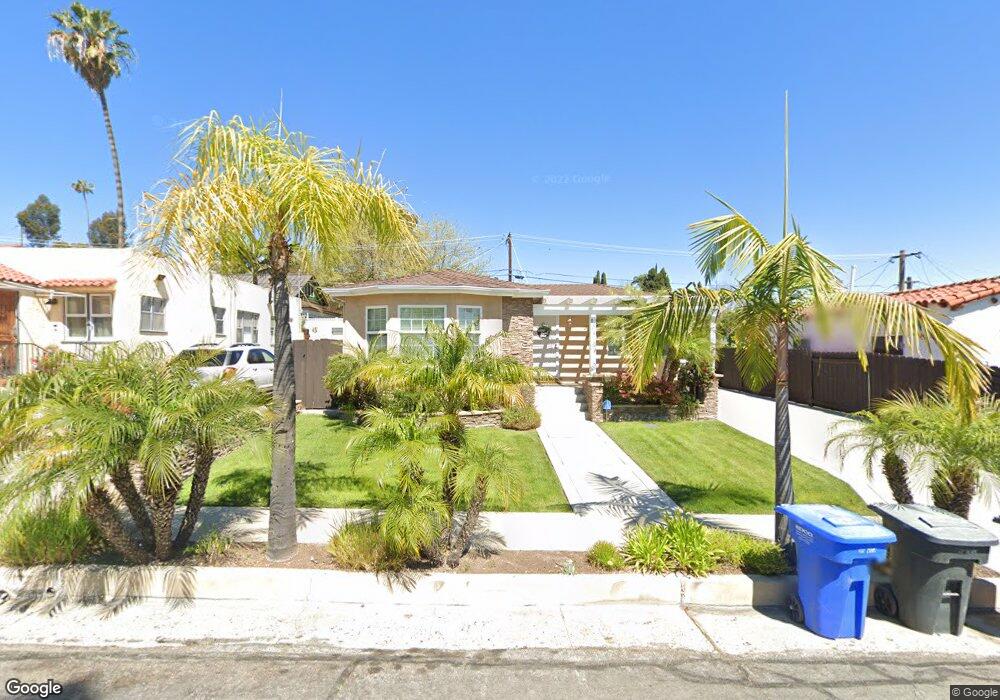
8050 University Place La Mesa, CA 91942
Estimated Value: $666,000 - $794,000
2
Beds
1
Bath
1,070
Sq Ft
$676/Sq Ft
Est. Value
About This Home
This home is located at 8050 University Place, La Mesa, CA 91942 and is currently estimated at $722,928, approximately $675 per square foot. 8050 University Place is a home located in San Diego County with nearby schools including La Mesa Arts Academy, Rolando Elementary School, and Mount Miguel High School.
Ownership History
Date
Name
Owned For
Owner Type
Purchase Details
Closed on
Jan 31, 2018
Sold by
Peraza Robert Toby
Bought by
Peraza Robert T and Hurt Watson Lansel A
Current Estimated Value
Purchase Details
Closed on
Dec 13, 2010
Sold by
Peraza Robert Toby and Hurt Watson Lansel A
Bought by
Peraza Robert Toby
Home Financials for this Owner
Home Financials are based on the most recent Mortgage that was taken out on this home.
Original Mortgage
$228,200
Outstanding Balance
$150,691
Interest Rate
4.21%
Mortgage Type
New Conventional
Estimated Equity
$572,237
Purchase Details
Closed on
May 30, 2000
Sold by
Gonzalez John & Theresa J Trs
Bought by
Peraza Robert Toby
Home Financials for this Owner
Home Financials are based on the most recent Mortgage that was taken out on this home.
Original Mortgage
$152,000
Interest Rate
11.62%
Purchase Details
Closed on
Dec 19, 1984
Create a Home Valuation Report for This Property
The Home Valuation Report is an in-depth analysis detailing your home's value as well as a comparison with similar homes in the area
Home Values in the Area
Average Home Value in this Area
Purchase History
| Date | Buyer | Sale Price | Title Company |
|---|---|---|---|
| Peraza Robert T | -- | None Available | |
| Peraza Robert Toby | -- | First American Title Company | |
| Peraza Robert Toby | $190,000 | American Title Ins Co | |
| -- | $80,000 | -- |
Source: Public Records
Mortgage History
| Date | Status | Borrower | Loan Amount |
|---|---|---|---|
| Open | Peraza Robert Toby | $228,200 | |
| Previous Owner | Peraza Robert Toby | $152,000 |
Source: Public Records
Tax History Compared to Growth
Tax History
| Year | Tax Paid | Tax Assessment Tax Assessment Total Assessment is a certain percentage of the fair market value that is determined by local assessors to be the total taxable value of land and additions on the property. | Land | Improvement |
|---|---|---|---|---|
| 2025 | $3,916 | $286,274 | $143,137 | $143,137 |
| 2024 | $3,916 | $280,662 | $140,331 | $140,331 |
| 2023 | $3,796 | $275,160 | $137,580 | $137,580 |
| 2022 | $3,745 | $269,766 | $134,883 | $134,883 |
| 2021 | $3,680 | $264,478 | $132,239 | $132,239 |
| 2020 | $3,618 | $261,768 | $130,884 | $130,884 |
| 2019 | $3,560 | $256,636 | $128,318 | $128,318 |
| 2018 | $3,484 | $251,604 | $125,802 | $125,802 |
| 2017 | $3,433 | $246,672 | $123,336 | $123,336 |
| 2016 | $3,337 | $241,836 | $120,918 | $120,918 |
| 2015 | $3,300 | $238,204 | $119,102 | $119,102 |
| 2014 | $3,238 | $233,538 | $116,769 | $116,769 |
Source: Public Records
Map
Nearby Homes
- 7932-40 La Mesa Blvd
- 7940 University Ave Unit 34
- 7621 University Ave Unit 103
- 4701 Date Ave Unit 219
- 4701 Date Ave Unit 205
- 4701 Date Ave Unit 108
- 7781 Sunset Dr
- 4800 Lee Ave
- 7861 Cimarron Ln
- 8033 Fairview Ave
- 4874 Palm Ave
- 5091 Guava Ave
- 5092 Guava Ave Unit 130
- 7725 El Cajon Blvd Unit 4
- 7725 El Cajon Blvd Unit 5
- Lot 48 Guava
- 5015 Comanche Dr
- 4475 Dale Ave Unit 106
- 7691 University Ave Unit 102
- 4464 Maple Ave
- 8058 University Place
- 8042 University Place
- 8053 Culowee St
- 8032 University Place
- 8032 University Place
- 8030 University Ave
- 8045 Culowee St
- 8024 University Ave
- 8040 University Ave
- 8051 University Place
- 8069 Culowee St
- 8041 University Place
- 8029 Culowee St
- 8022 University Place
- 8033 University Place
- 8050 University Ave
- 8021 Culowee St
- 8020 University Ave
- 8014 University Place
- 8023 University Place