8051 Pea Tree Ct Trinity, FL 34655
Estimated Value: $430,000 - $532,000
5
Beds
3
Baths
2,248
Sq Ft
$209/Sq Ft
Est. Value
About This Home
This home is located at 8051 Pea Tree Ct, Trinity, FL 34655 and is currently estimated at $470,633, approximately $209 per square foot. 8051 Pea Tree Ct is a home located in Pasco County with nearby schools including Trinity Oaks Elementary School, Seven Springs Middle School, and James W. Mitchell High School.
Ownership History
Date
Name
Owned For
Owner Type
Purchase Details
Closed on
Sep 22, 2010
Sold by
Morgan Coreen and Morgan Steven
Bought by
Tuttle Timothy and Tuttle Sheryl L
Current Estimated Value
Purchase Details
Closed on
Dec 21, 2006
Sold by
Morgan Coreen and Morgan Steven
Bought by
Morgan Steven and Morgan Coreen
Home Financials for this Owner
Home Financials are based on the most recent Mortgage that was taken out on this home.
Original Mortgage
$327,000
Interest Rate
6.07%
Mortgage Type
Purchase Money Mortgage
Purchase Details
Closed on
May 23, 2006
Sold by
M I Homes Of Tampa Llc
Bought by
Morgan Steven C and Morgan Coreen J
Home Financials for this Owner
Home Financials are based on the most recent Mortgage that was taken out on this home.
Original Mortgage
$277,550
Interest Rate
6.41%
Mortgage Type
Fannie Mae Freddie Mac
Purchase Details
Closed on
Oct 4, 2005
Sold by
Adam Smith Enterprises Inc
Bought by
M/I Homes Of Tampa Llc
Create a Home Valuation Report for This Property
The Home Valuation Report is an in-depth analysis detailing your home's value as well as a comparison with similar homes in the area
Home Values in the Area
Average Home Value in this Area
Purchase History
| Date | Buyer | Sale Price | Title Company |
|---|---|---|---|
| Tuttle Timothy | $195,000 | C A R E Title Inc | |
| Morgan Steven | $109,000 | Industry Partners Title Llc | |
| Morgan Steven C | $308,433 | M-I Title Agency Ltd Lc | |
| M/I Homes Of Tampa Llc | $2,100,000 | -- |
Source: Public Records
Mortgage History
| Date | Status | Borrower | Loan Amount |
|---|---|---|---|
| Previous Owner | Morgan Steven | $327,000 | |
| Previous Owner | Morgan Steven C | $277,550 |
Source: Public Records
Tax History
| Year | Tax Paid | Tax Assessment Tax Assessment Total Assessment is a certain percentage of the fair market value that is determined by local assessors to be the total taxable value of land and additions on the property. | Land | Improvement |
|---|---|---|---|---|
| 2026 | $3,038 | $215,060 | -- | -- |
| 2025 | $3,038 | $215,060 | -- | -- |
| 2024 | $3,038 | $203,110 | -- | -- |
| 2023 | $2,924 | $197,200 | $65,464 | $131,736 |
| 2022 | $2,629 | $191,460 | $0 | $0 |
| 2021 | $2,576 | $185,890 | $49,136 | $136,754 |
| 2020 | $2,533 | $183,330 | $44,313 | $139,017 |
| 2019 | $2,487 | $179,210 | $0 | $0 |
| 2018 | $2,439 | $175,872 | $0 | $0 |
| 2017 | $2,426 | $175,872 | $0 | $0 |
| 2016 | $2,360 | $168,712 | $0 | $0 |
| 2015 | $2,391 | $167,539 | $0 | $0 |
| 2014 | $2,326 | $173,804 | $40,113 | $133,691 |
Source: Public Records
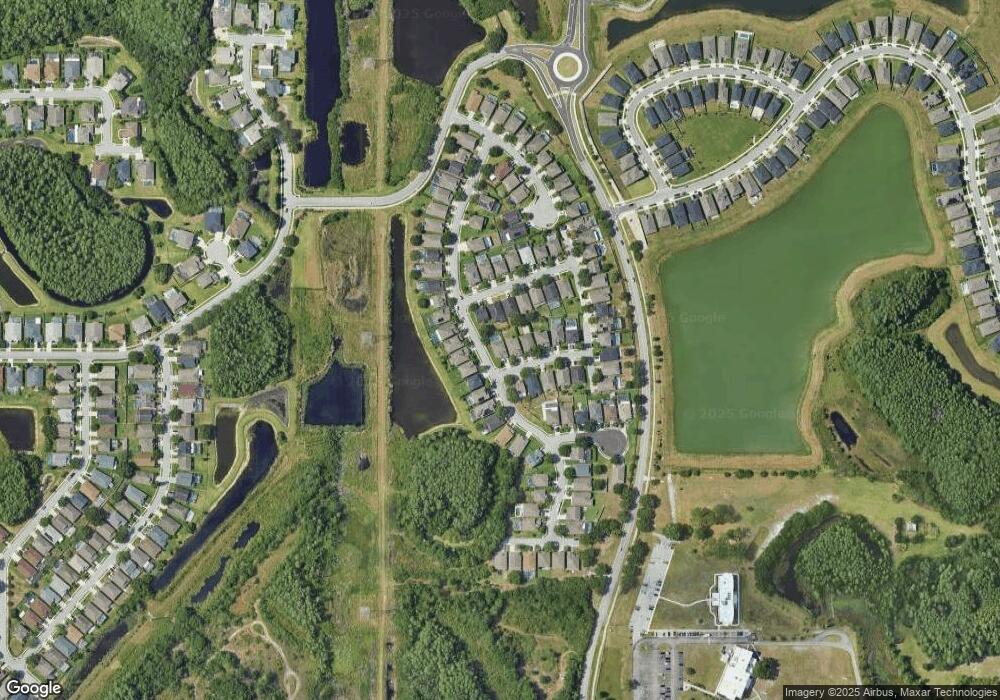
Map
Nearby Homes
- 8131 Lucidul Ct
- 8289 Olympic Stone Cir
- 2550 Maylin Dr
- 8174 Capstone Ranch Dr
- 8364 Capstone Ranch Dr
- 8249 Capstone Ranch Dr
- 2653 Longleaf Pine Point
- 8280 Rolling Tides Dr
- 2807 Manning Dr
- 7636 Wimpole Dr
- 8299 Birch Haven Ln
- 8232 Crescent Oaks Dr
- 2328 Brinley Dr
- 7820 Jenner Ave
- 8211 Crescent Oaks Dr
- 8339 Birch Haven Ln
- 8217 Crescent Oaks Dr
- 8249 Crescent Oaks Dr
- 8299 Crescent Oaks Dr
- 8241 Corner Pine Way
- 8101 Pea Tree Ct
- 8105 Pea Tree Ct
- 8038 Spirit Ct
- 8044 Spirit Ct
- 2645 Micah Dr
- 2649 Micah Dr
- 2641 Micah Dr
- 8050 Spirit Ct
- 2653 Micah Dr
- 8111 Pea Tree Ct
- 8052 Pea Tree Ct
- 2637 Micah Dr
- 8102 Pea Tree Ct
- 8100 Spirit Ct
- 2703 Micah Dr
- 8106 Pea Tree Ct
- 2633 Micah Dr
- 8115 Pea Tree Ct
- 8104 Spirit Ct
- 2709 Micah Dr
Your Personal Tour Guide
Ask me questions while you tour the home.