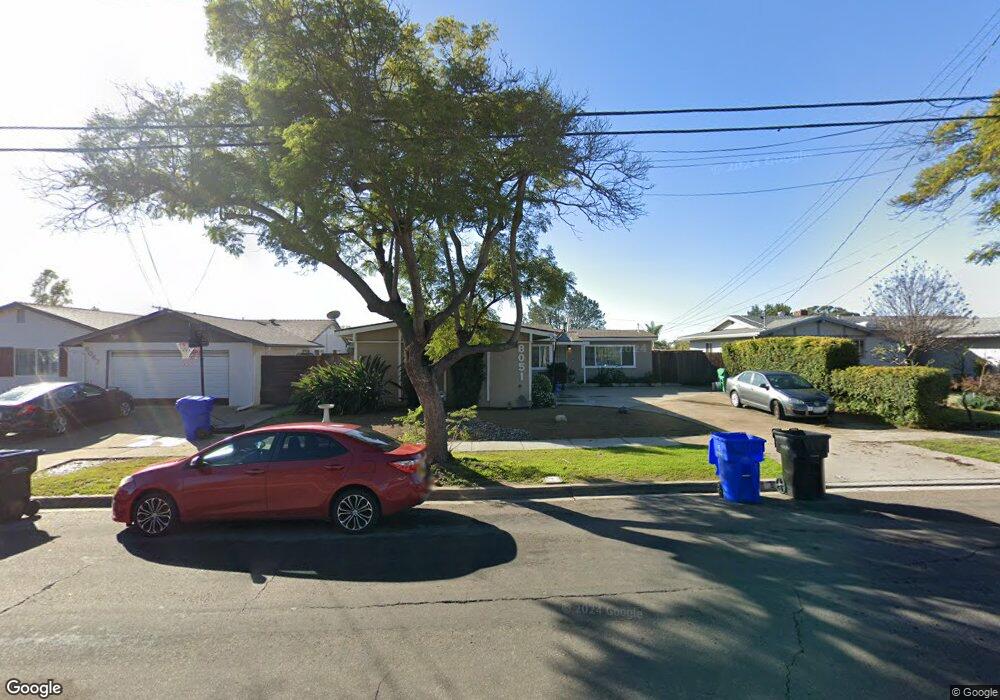
8051 San Carlos Dr San Diego, CA 92119
Lake Murray NeighborhoodEstimated Value: $799,832 - $985,000
3
Beds
2
Baths
1,126
Sq Ft
$805/Sq Ft
Est. Value
About This Home
This home is located at 8051 San Carlos Dr, San Diego, CA 92119 and is currently estimated at $906,458, approximately $805 per square foot. 8051 San Carlos Dr is a home located in San Diego County with nearby schools including Benchley-Weinberger Elementary, Pershing Middle School, and Patrick Henry High School.
Ownership History
Date
Name
Owned For
Owner Type
Purchase Details
Closed on
Feb 18, 2011
Sold by
Sellers Debra A
Bought by
Gilman Tiffany Nicole
Current Estimated Value
Purchase Details
Closed on
Aug 23, 2010
Sold by
Gilman Kathy
Bought by
Gilman Janice K
Purchase Details
Closed on
Nov 29, 2001
Sold by
Buenviaje Edgardo Cupcupin
Bought by
Buenviaje Nina Wakefield
Home Financials for this Owner
Home Financials are based on the most recent Mortgage that was taken out on this home.
Original Mortgage
$206,755
Outstanding Balance
$80,274
Interest Rate
6.63%
Mortgage Type
FHA
Estimated Equity
$826,184
Purchase Details
Closed on
Nov 5, 2001
Sold by
Morrison Francisca A and Buenviaje Nina Wakefield
Bought by
Alvarez Prascedis Paul and Alvarez Theresa M
Home Financials for this Owner
Home Financials are based on the most recent Mortgage that was taken out on this home.
Original Mortgage
$206,755
Outstanding Balance
$80,274
Interest Rate
6.63%
Mortgage Type
FHA
Estimated Equity
$826,184
Purchase Details
Closed on
Mar 25, 1985
Purchase Details
Closed on
Aug 9, 1984
Create a Home Valuation Report for This Property
The Home Valuation Report is an in-depth analysis detailing your home's value as well as a comparison with similar homes in the area
Home Values in the Area
Average Home Value in this Area
Purchase History
| Date | Buyer | Sale Price | Title Company |
|---|---|---|---|
| Gilman Tiffany Nicole | -- | None Available | |
| Gilman Janice K | -- | None Available | |
| Buenviaje Nina Wakefield | -- | First American Title | |
| Alvarez Prascedis Paul | $210,000 | First American Title | |
| -- | $95,000 | -- | |
| -- | $93,500 | -- |
Source: Public Records
Mortgage History
| Date | Status | Borrower | Loan Amount |
|---|---|---|---|
| Open | Alvarez Prascedis Paul | $206,755 |
Source: Public Records
Tax History Compared to Growth
Tax History
| Year | Tax Paid | Tax Assessment Tax Assessment Total Assessment is a certain percentage of the fair market value that is determined by local assessors to be the total taxable value of land and additions on the property. | Land | Improvement |
|---|---|---|---|---|
| 2025 | $2,396 | $192,914 | $76,701 | $116,213 |
| 2024 | $2,396 | $189,133 | $75,198 | $113,935 |
| 2023 | $2,263 | $185,425 | $73,724 | $111,701 |
| 2022 | $2,202 | $181,790 | $72,279 | $109,511 |
| 2021 | $2,185 | $178,226 | $70,862 | $107,364 |
| 2020 | $2,158 | $176,400 | $70,136 | $106,264 |
| 2019 | $2,119 | $172,942 | $68,761 | $104,181 |
| 2018 | $2,064 | $169,552 | $67,413 | $102,139 |
| 2017 | $2,015 | $166,229 | $66,092 | $100,137 |
| 2016 | $1,982 | $162,971 | $64,797 | $98,174 |
| 2015 | $1,953 | $160,524 | $63,824 | $96,700 |
| 2014 | $1,917 | $157,380 | $62,574 | $94,806 |
Source: Public Records
Map
Nearby Homes
- 7976 Lake Cayuga Dr
- 6548 Bantam Lake Cir
- 7838 Cowles Mountain Ct Unit C6
- 7838 Cowles Mountain Ct Unit C32
- 7838 Cowles Mountain Ct Unit 18
- 7835 Cowles Mountain Ct Unit B6
- 8343 San Carlos Dr
- 8374 Lake Gaby Ave
- 6767 Cowles Mountain Blvd
- 6750 Cowles Mountain Blvd
- 7773 Eagle Ridge Dr
- 8364 Lake Ashwood Ave
- 8402 Boulder Place
- 8419 Hudson Dr
- 6476 Jackson Dr
- 6387 Anvil Lake Ave
- 6388 Anvil Lake Ave
- 6371 Twin Lake Dr
- 6224 Rose Lake Ave
- 8447 Harwell Dr
- 8039 San Carlos Dr
- 8063 San Carlos Dr
- 8072 Beaver Lake Dr
- 8062 Beaver Lake Dr
- 8082 Beaver Lake Dr
- 8027 San Carlos Dr
- 8052 Beaver Lake Dr
- 8015 San Carlos Dr
- 8103 San Carlos Dr
- 6501 Bantam Lake Ave
- 8102 Beaver Lake Dr
- 8042 Beaver Lake Dr
- 8113 San Carlos Dr
- 8003 San Carlos Dr
- 6511 Bantam Lake Ave
- 8112 Beaver Lake Dr
- 8032 Beaver Lake Dr
- 8071 Beaver Lake Dr
- 8061 Beaver Lake Dr
- 8081 Beaver Lake Dr