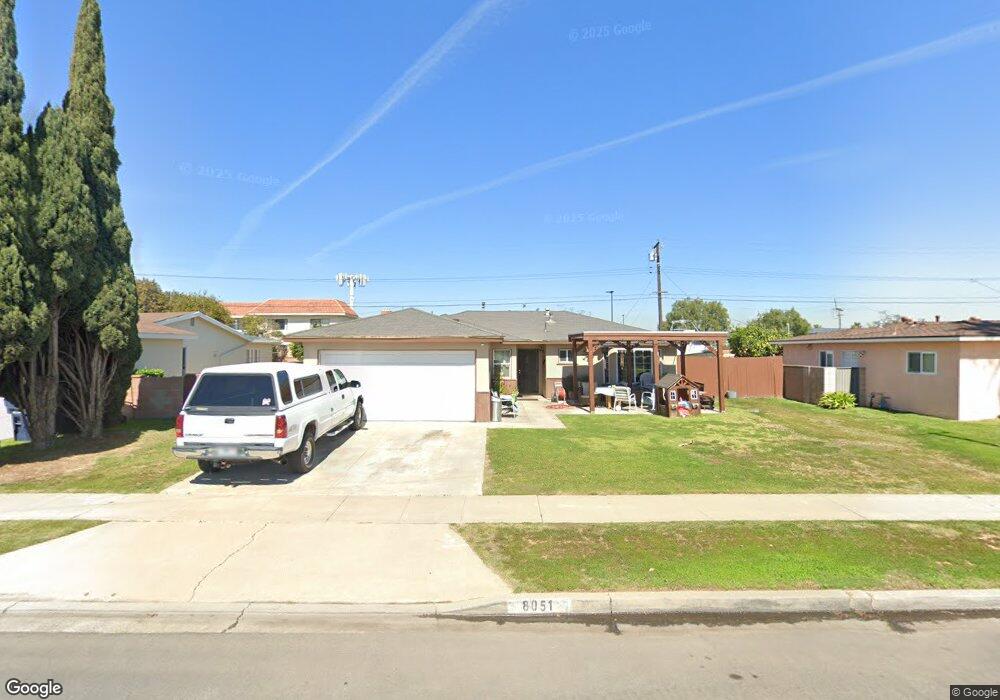
8051 Sterling Dr Huntington Beach, CA 92646
Estimated Value: $1,263,000 - $1,372,579
4
Beds
3
Baths
2,107
Sq Ft
$625/Sq Ft
Est. Value
About This Home
This home is located at 8051 Sterling Dr, Huntington Beach, CA 92646 and is currently estimated at $1,316,395, approximately $624 per square foot. 8051 Sterling Dr is a home located in Orange County with nearby schools including Lake View Elementary, Vista View Middle School, and Ocean View High.
Ownership History
Date
Name
Owned For
Owner Type
Purchase Details
Closed on
Dec 1, 2017
Sold by
Nelson Michael J and Nelson Jerry A
Bought by
Nelson Michael James and Nelson Jerry Ann
Current Estimated Value
Purchase Details
Closed on
Jun 20, 1996
Sold by
Cronk Robert F and Cronk Brunilda L
Bought by
Nelson Michael J and Nelson Jerry A
Create a Home Valuation Report for This Property
The Home Valuation Report is an in-depth analysis detailing your home's value as well as a comparison with similar homes in the area
Home Values in the Area
Average Home Value in this Area
Purchase History
| Date | Buyer | Sale Price | Title Company |
|---|---|---|---|
| Nelson Michael James | -- | None Available | |
| Nelson Michael J | -- | -- |
Source: Public Records
Tax History Compared to Growth
Tax History
| Year | Tax Paid | Tax Assessment Tax Assessment Total Assessment is a certain percentage of the fair market value that is determined by local assessors to be the total taxable value of land and additions on the property. | Land | Improvement |
|---|---|---|---|---|
| 2025 | $4,310 | $372,117 | $209,394 | $162,723 |
| 2024 | $4,310 | $364,821 | $205,288 | $159,533 |
| 2023 | $4,210 | $357,668 | $201,263 | $156,405 |
| 2022 | $4,144 | $350,655 | $197,316 | $153,339 |
| 2021 | $4,068 | $343,780 | $193,447 | $150,333 |
| 2020 | $4,022 | $340,255 | $191,463 | $148,792 |
| 2019 | $3,954 | $333,584 | $187,709 | $145,875 |
| 2018 | $3,865 | $327,044 | $184,029 | $143,015 |
| 2017 | $3,803 | $320,632 | $180,421 | $140,211 |
| 2016 | $3,650 | $314,346 | $176,884 | $137,462 |
| 2015 | $3,593 | $309,625 | $174,227 | $135,398 |
| 2014 | $3,521 | $303,560 | $170,814 | $132,746 |
Source: Public Records
Map
Nearby Homes
- 18101 Wharton Ln
- 7827 Orchid Dr
- 7841 Essex Dr Unit 201
- 18441 Patterson Ln
- 18232 Parkview Ln Unit 103
- 18272 Parkview Ln Unit 101
- 18021 Gulf Ln
- 17952 Seaglass Dr
- 7702 Alberta Dr
- 18507 Pueblo Cir
- 17722 Sergio Cir Unit 104
- 17722 Sergio Cir Unit 203
- 7802 Newman Ave
- 18555 Vallarta Dr
- 7792 Liberty Dr
- 17661 Sergio Cir Unit 103
- 17641 Sergio Cir Unit 203
- 18702 Demion Ln
- 8292 Darsy Dr
- 18712 Demion Ln
- 8071 Sterling Dr
- 8041 Sterling Dr
- 8081 Sterling Dr
- 8021 Sterling Dr
- 18151 Gleada Ln
- 18152 Gleada Ln
- 8015 Sterling Dr
- 8101 Sterling Dr
- 8011 Sterling Dr
- 18171 Gleada Ln
- 18172 Gleada Ln
- 18090 Beach Blvd
- 18090 Beach Blvd Unit 10
- 18090 Beach Blvd Unit 3
- 18151 Vallea Cir
- 18152 Beach Blvd
- 18181 Gleada Ln
- 18161 Vallea Cir
- 8111 Sterling Dr
- 18182 Gleada Ln