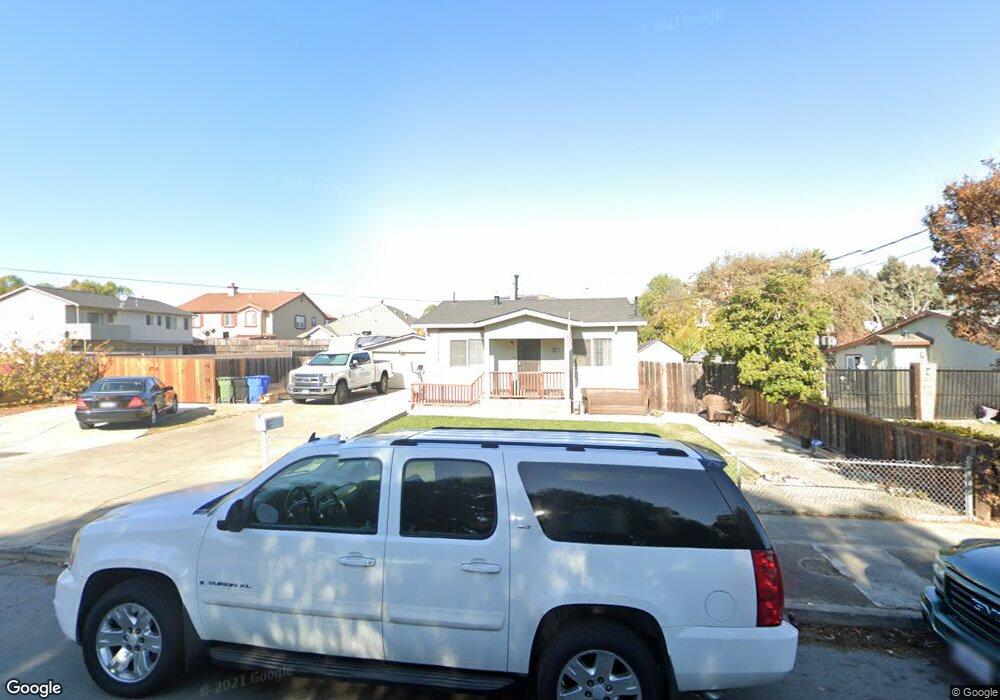
8051 Wells Ave Newark, CA 94560
Estimated Value: $822,000 - $1,248,000
3
Beds
2
Baths
702
Sq Ft
$1,395/Sq Ft
Est. Value
About This Home
This home is located at 8051 Wells Ave, Newark, CA 94560 and is currently estimated at $978,984, approximately $1,394 per square foot. 8051 Wells Ave is a home located in Alameda County with nearby schools including August Schilling Elementary School, Newark Junior High School, and Newark Memorial High School.
Ownership History
Date
Name
Owned For
Owner Type
Purchase Details
Closed on
Dec 29, 2011
Sold by
Kyi Ding Yu Craig
Bought by
Ong Aik Liang
Current Estimated Value
Purchase Details
Closed on
Dec 27, 2011
Sold by
Federal Home Loan Mortgage Corporation
Bought by
Ong Aik Liang
Purchase Details
Closed on
Apr 28, 2011
Sold by
Singh Amarjeet
Bought by
Federal Home Loan Mortgage Corporation
Purchase Details
Closed on
Dec 17, 2003
Sold by
Silva Serafin F and Silva Maria F
Bought by
Singh Amarjeet
Home Financials for this Owner
Home Financials are based on the most recent Mortgage that was taken out on this home.
Original Mortgage
$300,000
Interest Rate
6.37%
Mortgage Type
Purchase Money Mortgage
Purchase Details
Closed on
Dec 15, 2003
Sold by
Kaur Jasdeep
Bought by
Singh Amarjeet
Home Financials for this Owner
Home Financials are based on the most recent Mortgage that was taken out on this home.
Original Mortgage
$300,000
Interest Rate
6.37%
Mortgage Type
Purchase Money Mortgage
Create a Home Valuation Report for This Property
The Home Valuation Report is an in-depth analysis detailing your home's value as well as a comparison with similar homes in the area
Home Values in the Area
Average Home Value in this Area
Purchase History
We collect this data history from publicly available records. To have your information removed, we recommend requesting removal directly through your county’s website.
| Date | Buyer | Sale Price | Title Company |
|---|---|---|---|
| Ong Aik Liang | -- | Lsi Title Company | |
| Ong Aik Liang | $220,000 | Lsi Title Company | |
| Federal Home Loan Mortgage Corporation | $185,557 | Accommodation | |
| Singh Amarjeet | $375,000 | Fidelity National Title | |
| Singh Amarjeet | -- | Fidelity National Title |
Source: Public Records
Mortgage History
We collect this data history from publicly available records. To have your information removed, we recommend requesting removal directly through your county’s website.
| Date | Status | Borrower | Loan Amount |
|---|---|---|---|
| Previous Owner | Singh Amarjeet | $300,000 | |
| Closed | Singh Amarjeet | $37,500 |
Source: Public Records
Tax History
| Year | Tax Paid | Tax Assessment Tax Assessment Total Assessment is a certain percentage of the fair market value that is determined by local assessors to be the total taxable value of land and additions on the property. | Land | Improvement |
|---|---|---|---|---|
| 2025 | $3,918 | $279,598 | $125,599 | $153,999 |
| 2024 | $3,918 | $274,117 | $123,137 | $150,980 |
| 2023 | $3,798 | $268,744 | $120,723 | $148,021 |
| 2022 | $3,731 | $263,474 | $118,356 | $145,118 |
| 2021 | $3,643 | $258,310 | $116,036 | $142,274 |
| 2020 | $3,503 | $252,663 | $114,847 | $137,816 |
| 2019 | $3,458 | $247,711 | $112,596 | $135,115 |
| 2018 | $3,402 | $242,855 | $110,389 | $132,466 |
| 2017 | $3,316 | $238,095 | $108,225 | $129,870 |
| 2016 | $3,270 | $233,426 | $106,103 | $127,323 |
| 2015 | $3,259 | $229,922 | $104,510 | $125,412 |
| 2014 | $3,167 | $225,418 | $102,463 | $122,955 |
Source: Public Records
Map
Nearby Homes
- 37266 Spruce St
- 37052 Poplar St
- 8420 Blue Anchor Way
- 37340 Locust St
- 37532 Bay Crest Rd
- 37645 Bay Crest Rd
- 37517 Bay Crest Rd
- 37549 Willow St
- 8533 Seawind Way
- 36862 Walnut St
- 37630 Breakers Rd
- 6417/6433 Thornton Ave
- 8556 Seawind Way
- 8576 Tailwind Ave
- 7995 Peachtree Ave
- 8551 Boardwalk Way
- 8562 Cabana Way
- 8550 Boardwalk Way
- 36671 Ponderosa Ct
- 37515 Sea Bank St
- 8129 Wells Ave
- 8035 Wells Ave
- 8106 Mandarin Ave
- 8118 Mandarin Ave
- 8094 Mandarin Ave
- 8130 Mandarin Ave
- 8141 Wells Ave
- 8019 Wells Ave
- 8088 Wells Ave
- 8142 Mandarin Ave
- 8153 Wells Ave
- 8082 Mandarin Ave
- 37265 Spruce St
- 37249 Spruce St
- 37283 Spruce St
- 8070 Mandarin Ave
- 37248 Acorn Place
- 37233 Spruce St
- 37262 Acorn Place
- 37240 Acorn Place
Your Personal Tour Guide
Ask me questions while you tour the home.