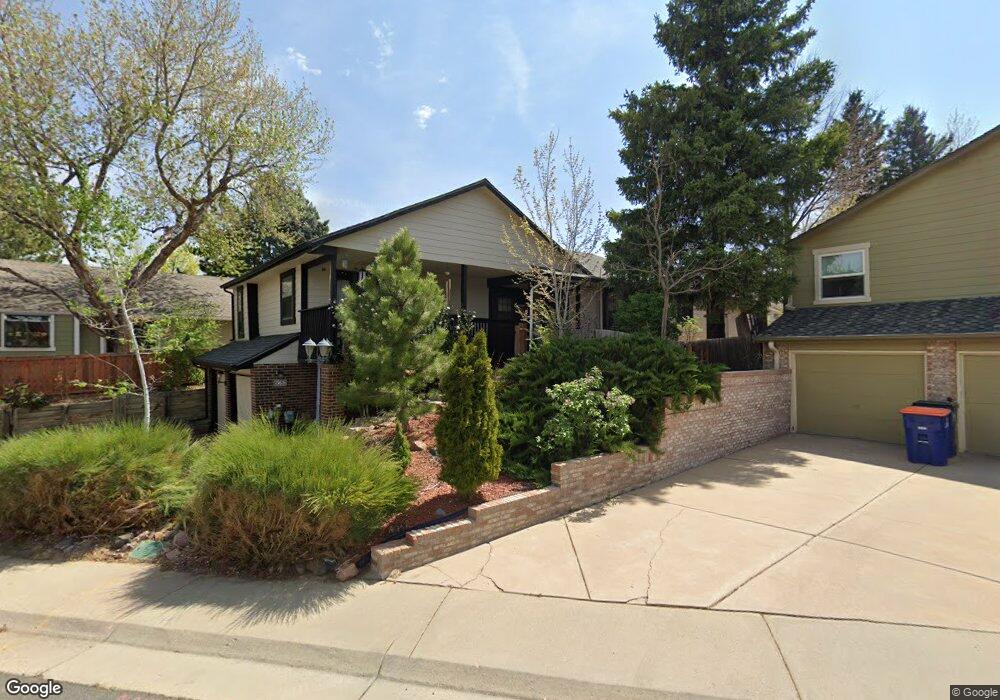
8052 S Niagara Way Centennial, CO 80112
Foxridge NeighborhoodEstimated Value: $699,000 - $734,000
3
Beds
3
Baths
1,884
Sq Ft
$383/Sq Ft
Est. Value
About This Home
This home is located at 8052 S Niagara Way, Centennial, CO 80112 and is currently estimated at $721,831, approximately $383 per square foot. 8052 S Niagara Way is a home located in Arapahoe County with nearby schools including Dry Creek Elementary School, West Middle School, and Cherry Creek High School.
Ownership History
Date
Name
Owned For
Owner Type
Purchase Details
Closed on
Mar 13, 1992
Sold by
Anderson James Stephen and Anderson Juliann S
Bought by
Lasky Stephen M and Lasky Gertrude M
Current Estimated Value
Purchase Details
Closed on
Aug 15, 1989
Sold by
Conversion Arapco
Bought by
Anderson James Stephen and Anderson Juliann S
Purchase Details
Closed on
Apr 1, 1985
Sold by
Conversion Arapco
Bought by
Conversion Arapco
Purchase Details
Closed on
Dec 1, 1983
Sold by
Conversion Arapco
Bought by
Conversion Arapco
Purchase Details
Closed on
Aug 1, 1978
Sold by
Conversion Arapco
Bought by
Conversion Arapco
Purchase Details
Closed on
Jul 4, 1776
Bought by
Conversion Arapco
Create a Home Valuation Report for This Property
The Home Valuation Report is an in-depth analysis detailing your home's value as well as a comparison with similar homes in the area
Home Values in the Area
Average Home Value in this Area
Purchase History
| Date | Buyer | Sale Price | Title Company |
|---|---|---|---|
| Lasky Stephen M | -- | -- | |
| Anderson James Stephen | -- | -- | |
| Conversion Arapco | -- | -- | |
| Conversion Arapco | -- | -- | |
| Conversion Arapco | -- | -- | |
| Conversion Arapco | -- | -- |
Source: Public Records
Tax History Compared to Growth
Tax History
| Year | Tax Paid | Tax Assessment Tax Assessment Total Assessment is a certain percentage of the fair market value that is determined by local assessors to be the total taxable value of land and additions on the property. | Land | Improvement |
|---|---|---|---|---|
| 2024 | $4,157 | $41,801 | -- | -- |
| 2023 | $4,157 | $41,801 | $0 | $0 |
| 2022 | $3,681 | $34,562 | $0 | $0 |
| 2021 | $3,701 | $34,562 | $0 | $0 |
| 2020 | $3,455 | $32,804 | $0 | $0 |
| 2019 | $3,214 | $32,804 | $0 | $0 |
| 2018 | $2,905 | $28,080 | $0 | $0 |
| 2017 | $2,870 | $28,080 | $0 | $0 |
| 2016 | $3,005 | $28,011 | $0 | $0 |
| 2015 | $2,890 | $28,011 | $0 | $0 |
| 2014 | -- | $22,535 | $0 | $0 |
| 2013 | -- | $20,680 | $0 | $0 |
Source: Public Records
Map
Nearby Homes
- 6166 E Mineral Place
- 8209 S Kearney St
- 7826 S Niagara Way
- 7679 S Monaco Cir W
- 8059 S Quince Cir
- 7640 S Monaco Cir W
- 7704 S Pontiac Ct
- 8540 Gold Peak Ln Unit C
- 8578 Gold Peak Dr Unit G
- 8578 Gold Peak Dr Unit D
- 8590 Gold Peak Dr Unit D
- 8626 Gold Peak Dr Unit B
- 8638 Gold Peak Dr Unit D
- 8650 Gold Peak Dr Unit A
- 5993 E Irwin Place
- 8555 Gold Peak Dr Unit B
- 5944 E Irwin Place
- 7006 E Dry Creek Place
- 7154 E Dry Creek Cir
- 7696 S Hudson Way
- 8056 S Niagara Way
- 8046 S Niagara Way
- 8053 S Newport Ct
- 8057 S Newport Ct
- 8062 S Niagara Way
- 8047 S Newport Ct
- 8042 S Niagara Way
- 8055 S Niagara Way
- 8063 S Newport Ct
- 8051 S Niagara Way
- 8043 S Newport Ct
- 8066 S Niagara Way
- 8065 S Niagara Way
- 8045 S Niagara Way
- 8036 S Niagara Way
- 8067 S Newport Ct
- 8039 S Newport Ct
- 8071 S Niagara Way
- 8060 S Newport Ct
- 8072 S Niagara Way