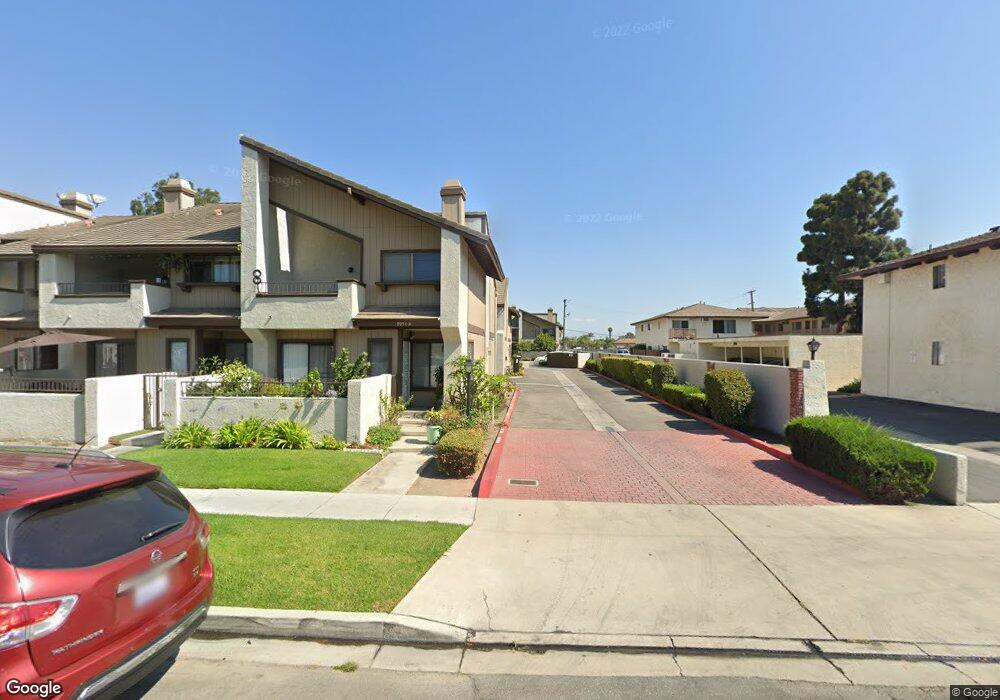
8053 Larson Ave Unit A Garden Grove, CA 92844
Koreatown NeighborhoodEstimated Value: $669,425 - $885,000
3
Beds
3
Baths
1,254
Sq Ft
$592/Sq Ft
Est. Value
About This Home
This home is located at 8053 Larson Ave Unit A, Garden Grove, CA 92844 and is currently estimated at $742,856, approximately $592 per square foot. 8053 Larson Ave Unit A is a home located in Orange County with nearby schools including Meairs Elementary School, Warner Middle, and Westminster High School.
Ownership History
Date
Name
Owned For
Owner Type
Purchase Details
Closed on
Nov 19, 2019
Sold by
Nguyen Alex and Nguyen Tan Xuan
Bought by
Nguyen Tan Xuan and Huynh Anh Thi
Current Estimated Value
Purchase Details
Closed on
Oct 6, 2003
Sold by
Huynh Anh Thi
Bought by
Nguyen Tan Xuan
Home Financials for this Owner
Home Financials are based on the most recent Mortgage that was taken out on this home.
Original Mortgage
$225,600
Interest Rate
6.27%
Mortgage Type
Purchase Money Mortgage
Purchase Details
Closed on
Sep 9, 2003
Sold by
Doan Hiep Trong and Ton Van Tuong
Bought by
Nguyen Alex and Nguyen Tan Xuan
Home Financials for this Owner
Home Financials are based on the most recent Mortgage that was taken out on this home.
Original Mortgage
$225,600
Interest Rate
6.27%
Mortgage Type
Purchase Money Mortgage
Purchase Details
Closed on
Dec 1, 1999
Sold by
Lui Alan S
Bought by
Doan Hiep Trong and Ton Van Tuong
Home Financials for this Owner
Home Financials are based on the most recent Mortgage that was taken out on this home.
Original Mortgage
$104,000
Interest Rate
7.72%
Create a Home Valuation Report for This Property
The Home Valuation Report is an in-depth analysis detailing your home's value as well as a comparison with similar homes in the area
Home Values in the Area
Average Home Value in this Area
Purchase History
| Date | Buyer | Sale Price | Title Company |
|---|---|---|---|
| Nguyen Tan Xuan | -- | First American Title Ins Co | |
| Nguyen Tan Xuan | -- | -- | |
| Nguyen Alex | $282,000 | -- | |
| Doan Hiep Trong | $139,000 | Landwood Title |
Source: Public Records
Mortgage History
| Date | Status | Borrower | Loan Amount |
|---|---|---|---|
| Previous Owner | Nguyen Tan Xuan | $225,600 | |
| Previous Owner | Doan Hiep Trong | $104,000 | |
| Closed | Nguyen Tan Xuan | $14,100 |
Source: Public Records
Tax History Compared to Growth
Tax History
| Year | Tax Paid | Tax Assessment Tax Assessment Total Assessment is a certain percentage of the fair market value that is determined by local assessors to be the total taxable value of land and additions on the property. | Land | Improvement |
|---|---|---|---|---|
| 2025 | $5,551 | $446,535 | $326,855 | $119,680 |
| 2024 | $5,551 | $437,780 | $320,446 | $117,334 |
| 2023 | $5,367 | $429,197 | $314,163 | $115,034 |
| 2022 | $5,284 | $420,782 | $308,003 | $112,779 |
| 2021 | $5,253 | $412,532 | $301,964 | $110,568 |
| 2020 | $5,190 | $408,302 | $298,867 | $109,435 |
| 2019 | $4,562 | $359,417 | $244,104 | $115,313 |
| 2018 | $4,554 | $352,370 | $239,318 | $113,052 |
| 2017 | $4,384 | $345,461 | $234,625 | $110,836 |
| 2016 | $4,213 | $338,688 | $230,025 | $108,663 |
| 2015 | $4,006 | $322,000 | $224,066 | $97,934 |
| 2014 | $3,783 | $304,325 | $206,391 | $97,934 |
Source: Public Records
Map
Nearby Homes
- 13141 Monroe St
- 8051 Acacia Ave Unit 23
- 8111 Stanford Ave
- 8111 Stanford Ave Unit 28
- 8361 Cerulean Dr
- 12892 Adelle St
- 8520 Lake Knoll Ave Unit B
- 13252 Newland St Unit A-D
- 8197 Jasmine Ave
- 12931 Josephine St
- 13175 Creek View Dr Unit F
- 7541 Benton Ave
- 8565 Edgebrook Dr
- 13532 Richardson Way
- 7811 24th St
- 7999 Stepping Stone Cir
- 8800 Garden Grove Blvd Unit 2
- 8442 Trask Ave
- 12562 Dale St Unit 47
- 7700 Lampson Ave Unit 52
- 8057 Larson Ave
- 8057 Larson Ave Unit E
- 8057 Larson Ave Unit C
- 8057 Larson Ave Unit B
- 8057 Larson Ave Unit A
- 8057 Larson Ave Unit D
- 8053 Larson Ave Unit B
- 8053 Larson Ave Unit C
- 8051 Larson Ave Unit D
- 8053 Larson Ave Unit D
- 8051 Larson Ave Unit B
- 8051 Larson Ave Unit C
- 8051 Larson Ave Unit A
- 8057 Larson Ave Unit 11
- 8051B Larson Ave Unit B
- 8055 Larson Ave Unit B
- 8055 Larson Ave Unit A
- 8031 Larson Ave
- 8021 Larson Ave
- 8101 Larson Ave