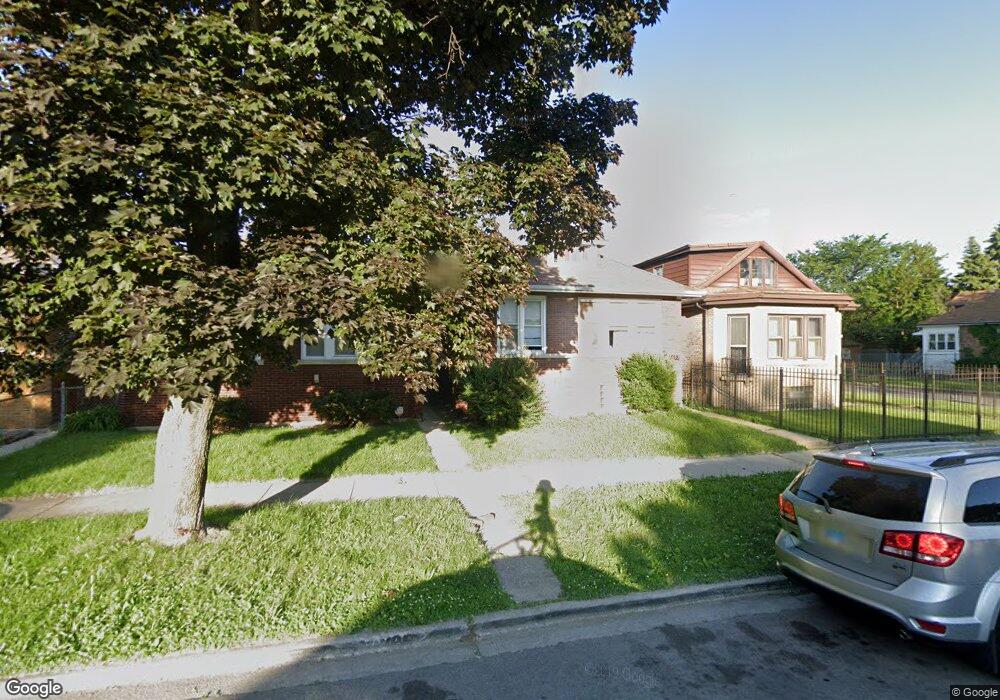
8053 S Kimbark Ave Chicago, IL 60619
Grand Crossing NeighborhoodEstimated Value: $162,000 - $230,000
3
Beds
2
Baths
1,800
Sq Ft
$115/Sq Ft
Est. Value
About This Home
This home is located at 8053 S Kimbark Ave, Chicago, IL 60619 and is currently estimated at $206,132, approximately $114 per square foot. 8053 S Kimbark Ave is a home located in Cook County with nearby schools including Emil G. Hirsch Metropolitan High School, CICS Avalon, and Betty Shabazz Academy.
Ownership History
Date
Name
Owned For
Owner Type
Purchase Details
Closed on
May 27, 2020
Sold by
Triple M Mazel Llc
Bought by
Bppo Properties 2020 1 Llc
Current Estimated Value
Purchase Details
Closed on
Jul 25, 2014
Sold by
Walker
Bought by
Triple M Mazel Llc
Purchase Details
Closed on
Sep 20, 2004
Sold by
Home Acquisitions Inc
Bought by
Walker Toly
Home Financials for this Owner
Home Financials are based on the most recent Mortgage that was taken out on this home.
Original Mortgage
$159,900
Interest Rate
6.08%
Mortgage Type
Unknown
Purchase Details
Closed on
May 19, 2004
Sold by
Schiller Inc
Bought by
Home Acquisitions Inc
Purchase Details
Closed on
May 10, 2004
Sold by
Lofton R L
Bought by
Schiller Inc
Purchase Details
Closed on
Feb 2, 2004
Sold by
Lofton Ethel and Hart Ernestine
Bought by
Schiller Inc
Create a Home Valuation Report for This Property
The Home Valuation Report is an in-depth analysis detailing your home's value as well as a comparison with similar homes in the area
Home Values in the Area
Average Home Value in this Area
Purchase History
| Date | Buyer | Sale Price | Title Company |
|---|---|---|---|
| Bppo Properties 2020 1 Llc | $776,500 | Chicago Title | |
| Triple M Mazel Llc | $39,500 | None Available | |
| Walker Toly | $160,000 | Lasalle Title | |
| Home Acquisitions Inc | $65,000 | Lasalle Title | |
| Schiller Inc | $12,000 | Lasalle Title | |
| Schiller Inc | $18,000 | -- |
Source: Public Records
Mortgage History
| Date | Status | Borrower | Loan Amount |
|---|---|---|---|
| Previous Owner | Walker Toly | $159,900 |
Source: Public Records
Tax History Compared to Growth
Tax History
| Year | Tax Paid | Tax Assessment Tax Assessment Total Assessment is a certain percentage of the fair market value that is determined by local assessors to be the total taxable value of land and additions on the property. | Land | Improvement |
|---|---|---|---|---|
| 2024 | $2,532 | $13,101 | $2,813 | $10,288 |
| 2023 | $2,468 | $12,001 | $4,688 | $7,313 |
| 2022 | $2,468 | $12,001 | $4,688 | $7,313 |
| 2021 | $2,413 | $11,999 | $4,687 | $7,312 |
| 2020 | $2,825 | $12,681 | $3,375 | $9,306 |
| 2019 | $2,831 | $14,090 | $3,375 | $10,715 |
| 2018 | $2,783 | $14,090 | $3,375 | $10,715 |
| 2017 | $2,850 | $13,237 | $3,000 | $10,237 |
| 2016 | $2,651 | $13,237 | $3,000 | $10,237 |
| 2015 | $2,426 | $13,237 | $3,000 | $10,237 |
| 2014 | $1,701 | $11,735 | $2,625 | $9,110 |
| 2013 | $1,873 | $12,928 | $2,625 | $10,303 |
Source: Public Records
Map
Nearby Homes
- 8101 S Kimbark Ave
- 8055 S Avalon Ave
- 8048 S Avalon Ave
- 8007 S Avalon Ave
- 8227 S Avalon Ave
- 1130 E 81st St Unit A
- 1129 E 81st St
- 8250 S Kenwood Ave
- 8235 S Woodlawn Ave
- 7521 S Kimbark Ave
- 8041 S Blackstone Ave
- 8035 S Blackstone Ave
- 8106 S Harper Ave
- 8005 S Blackstone Ave
- 8138 S Harper Ave
- 8200 S Harper Ave
- 1117 E 82nd Place
- 1059 E 80th St
- 7839 S Kimbark Ave
- 7930 S Anthony Ave
- 8059 S Kimbark Ave
- 8051 S Kimbark Ave
- 8059 S Kenwood Ave
- 8049 S Kimbark Ave
- 8045 S Kimbark Ave
- 8043 S Kimbark Ave
- 8056 S Kenwood Ave
- 8058 S Kenwood Ave
- 8050 S Kenwood Ave
- 8041 S Kimbark Ave
- 8044 S Kenwood Ave
- 8105 S Kimbark Ave
- 8037 S Kimbark Ave
- 8042 S Kenwood Ave
- 8054 S Kimbark Ave
- 8058 S Kimbark Ave
- 8048 S Kimbark Ave
- 8100 S Kenwood Ave
- 8046 S Kimbark Ave
- 8109 S Kimbark Ave