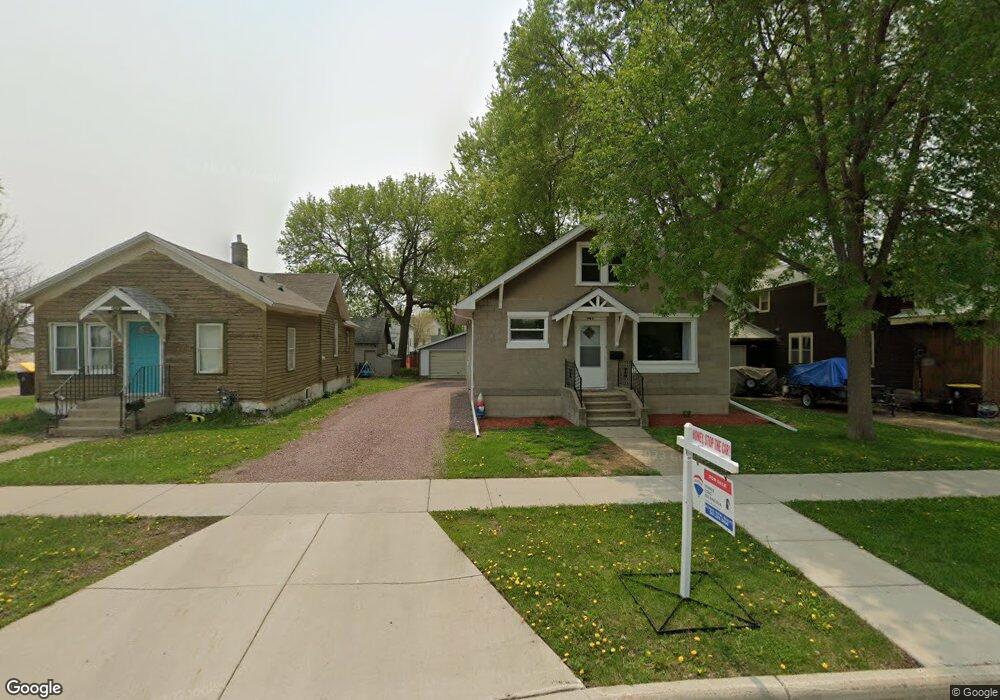
806 E 3 St Fairmont, MN 56031
Estimated Value: $113,000 - $125,000
3
Beds
1
Bath
1,254
Sq Ft
$94/Sq Ft
Est. Value
About This Home
This home is located at 806 E 3 St, Fairmont, MN 56031 and is currently estimated at $117,815, approximately $93 per square foot. 806 E 3 St is a home located in Martin County with nearby schools including Fairmont Elementary School, Fairmont Junior/Senior High School, and St. John Vianney School.
Ownership History
Date
Name
Owned For
Owner Type
Purchase Details
Closed on
Jun 30, 2023
Sold by
Jensen Brady and Jensen Chloe Rae
Bought by
Kroon Cameron
Current Estimated Value
Home Financials for this Owner
Home Financials are based on the most recent Mortgage that was taken out on this home.
Original Mortgage
$114,460
Outstanding Balance
$111,521
Interest Rate
6.39%
Mortgage Type
New Conventional
Estimated Equity
$6,294
Purchase Details
Closed on
Dec 2, 2021
Sold by
Jensen Andrew and Jensen Chelsey
Bought by
Jensen Brady and Diekmann Chloe
Home Financials for this Owner
Home Financials are based on the most recent Mortgage that was taken out on this home.
Original Mortgage
$74,900
Interest Rate
3.09%
Mortgage Type
New Conventional
Purchase Details
Closed on
May 4, 2012
Sold by
Strong Thomas L and Strong Loretta K
Bought by
Jensen Andrew
Home Financials for this Owner
Home Financials are based on the most recent Mortgage that was taken out on this home.
Original Mortgage
$37,240
Interest Rate
3.21%
Mortgage Type
New Conventional
Create a Home Valuation Report for This Property
The Home Valuation Report is an in-depth analysis detailing your home's value as well as a comparison with similar homes in the area
Home Values in the Area
Average Home Value in this Area
Purchase History
| Date | Buyer | Sale Price | Title Company |
|---|---|---|---|
| Kroon Cameron | $118,000 | None Listed On Document | |
| Jensen Brady | $94,900 | Compeer Title Services | |
| Jensen Andrew | $39,200 | None Available |
Source: Public Records
Mortgage History
| Date | Status | Borrower | Loan Amount |
|---|---|---|---|
| Open | Kroon Cameron | $114,460 | |
| Previous Owner | Jensen Brady | $74,900 | |
| Previous Owner | Jensen Andrew | $37,240 |
Source: Public Records
Tax History
| Year | Tax Paid | Tax Assessment Tax Assessment Total Assessment is a certain percentage of the fair market value that is determined by local assessors to be the total taxable value of land and additions on the property. | Land | Improvement |
|---|---|---|---|---|
| 2025 | $1,204 | $94,100 | $12,300 | $81,800 |
| 2024 | $1,032 | $94,100 | $12,300 | $81,800 |
| 2023 | $1,044 | $76,700 | $9,700 | $67,000 |
| 2022 | $497 | $72,500 | $10,400 | $62,100 |
| 2021 | $972 | $57,100 | $10,100 | $47,000 |
| 2020 | $924 | $56,800 | $10,100 | $46,700 |
| 2019 | $752 | $47,500 | $8,400 | $39,100 |
| 2018 | $728 | $28,700 | $7,200 | $21,500 |
| 2017 | $744 | $19,000 | $4,795 | $14,205 |
| 2016 | $812 | $21,100 | $5,350 | $15,750 |
| 2015 | $271 | $20,600 | $4,970 | $15,630 |
| 2013 | $315 | $20,300 | $4,745 | $15,555 |
Source: Public Records
Map
Nearby Homes
- 609 E 4th St
- 520 E Blue Earth Ave
- 603 Webster St
- 811 Tilden St
- 431 Webster St
- 714 Tilden St
- 1215 Webster St
- 231 S Prairie Ave
- 227 S Elm St
- 418 Forest St
- 405 Victoria St
- 1114 N Prairie Ave
- 841 Redwood Dr
- 411 Albion Ave
- 811 Burton Ln
- 117 E 11th St
- 915 S Hampton St
- 623 Washington Ave
- 1304 Camelot Ct
- 123 Linden Ave
Your Personal Tour Guide
Ask me questions while you tour the home.