


806 Main St Belpre, OH 45714
Estimated payment $1,426/month
Highlights
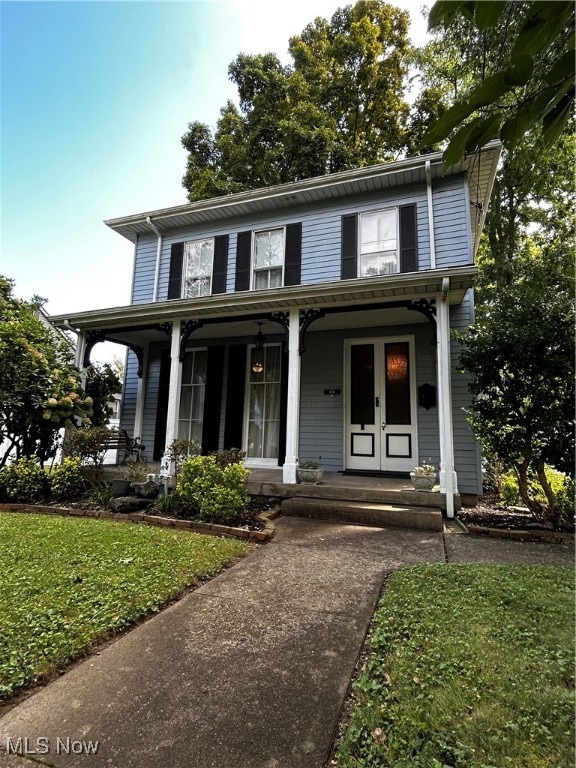
- Colonial Architecture
- No HOA
- Window Unit Cooling System
- 3 Fireplaces
- 2 Car Detached Garage
- Forced Air Heating and Cooling System
About This Home
Beautifully Updated Belpre Home with Wraparound Porch & Backyard Oasis This 4-bedroom, 1.5-bath home offers over 2,300 sq. ft. of living space along with a detached two-car garage. Inside you’ll find three fireplaces, beautiful original woodwork, and a layout designed for both everyday living and entertaining. The home balances character with comfort, featuring tasteful updates that blend seamlessly with its original charm. Recent improvements include a new roof and gutters (2017) and a freshly painted exterior (2024), giving you peace of mind for years to come. Outside is where this property truly shines. A welcoming wraparound porch greets you upon exit from the rear of the house. The large, level backyard is fully enclosed with a white privacy fence, offering a private and inviting space. A concrete patio adds the perfect spot for relaxing, outdoor dining, or hosting gatherings, making this outdoor retreat one of the home’s most impressive features. Located in the heart of Belpre, this property puts you close to schools, parks, shopping, and dining while still letting you enjoy small-town living. If you’ve been looking for a spacious home with character, modern updates, and an exceptional backyard, this one is a must-see.
Listing Agent
Advantage Real Estate Brokerage Email: 740-374-7325, nancyadvantage@yahoo.com License #2019002933 Listed on: 09/10/2025
Home Details
Home Type
- Single Family
Est. Annual Taxes
- $2,290
Year Built
- Built in 1900
Lot Details
- 0.32 Acre Lot
Parking
- 2 Car Detached Garage
Home Design
- Colonial Architecture
- Asphalt Roof
- Aluminum Siding
Interior Spaces
- 2,320 Sq Ft Home
- 2-Story Property
- 3 Fireplaces
- Unfinished Basement
Bedrooms and Bathrooms
- 4 Bedrooms
- 1.5 Bathrooms
Utilities
- Window Unit Cooling System
- Forced Air Heating and Cooling System
- Heating System Uses Gas
Community Details
- No Home Owners Association
- Holstein Acres Add/Belpre Subdivision
Listing and Financial Details
- Assessor Parcel Number 0800-36872-000
Map
Home Values in the Area
Average Home Value in this Area
Tax History
| Year | Tax Paid | Tax Assessment Tax Assessment Total Assessment is a certain percentage of the fair market value that is determined by local assessors to be the total taxable value of land and additions on the property. | Land | Improvement |
|---|---|---|---|---|
| 2024 | $3,233 | $59,420 | $9,170 | $50,250 |
| 2023 | $2,291 | $59,420 | $9,170 | $50,250 |
| 2022 | $2,279 | $59,420 | $9,170 | $50,250 |
| 2021 | $1,666 | $40,880 | $7,340 | $33,540 |
| 2020 | $1,672 | $40,880 | $7,340 | $33,540 |
| 2019 | $1,665 | $40,880 | $7,340 | $33,540 |
| 2018 | $1,495 | $35,350 | $6,110 | $29,240 |
| 2017 | $1,211 | $35,350 | $6,110 | $29,240 |
| 2016 | $1,759 | $35,350 | $6,110 | $29,240 |
| 2015 | $1,012 | $30,940 | $6,000 | $24,940 |
| 2014 | $1,542 | $30,940 | $6,000 | $24,940 |
| 2013 | $1,007 | $30,940 | $6,000 | $24,940 |
Property History
| Date | Event | Price | List to Sale | Price per Sq Ft |
|---|---|---|---|---|
| 03/03/2026 03/03/26 | Price Changed | $240,000 | -4.0% | $103 / Sq Ft |
| 09/10/2025 09/10/25 | For Sale | $250,000 | -- | $108 / Sq Ft |
Purchase History
| Date | Type | Sale Price | Title Company |
|---|---|---|---|
| Interfamily Deed Transfer | -- | None Available | |
| Deed | $64,000 | -- | |
| Deed | $64,000 | -- | |
| Deed | $70,000 | -- | |
| Deed | $70,000 | -- | |
| Deed | -- | -- | |
| Deed | -- | -- | |
| Deed | $52,500 | -- | |
| Deed | $52,500 | -- | |
| Deed | $50,800 | -- | |
| Deed | $50,800 | -- | |
| Deed | $65,000 | -- | |
| Deed | $65,000 | -- | |
| Deed | $65,000 | -- | |
| Deed | $65,000 | -- |
Source: MLS Now
MLS Number: 5155047
APN: 0800-36872-000
Disclaimer: Certain information contained herein is derived from information provided by parties other than Homes.com. All information provided is deemed reliable, but is not guaranteed to be accurate and should be independently verified.
![]() IDX information is provided exclusively for personal, non-commercial use, and may not be used for any purpose other than to identify prospective properties consumers may be interested in purchasing. Information is deemed reliable but not guaranteed.
IDX information is provided exclusively for personal, non-commercial use, and may not be used for any purpose other than to identify prospective properties consumers may be interested in purchasing. Information is deemed reliable but not guaranteed.
- 500 13th St
- 1026 Avery St
- 1026 Avery St
- 1016 Cornwall St
- 2ND Avery Ct Unit 2A
- 1572 Elizabeth St Unit C
- 1119 24th St Unit B
- 2801 Emerson Ave
- 824 Lakeview Dr
- 65 Willowbrook Dr
- 803 7th Ave Unit . A
- 147 Chateau Hills
- 509 Buckeye St
- 4813 Sayre Ave Unit 4813 Sayre Ave. Unit 1
- 1012 18th St
- 2212 36th St
- 114 Wildwood Dr Unit . 104
- 3623 Packard St
- 1202 19th St Unit . 8
- 1202 19th St Unit . 5

Ask me questions while you tour the home.