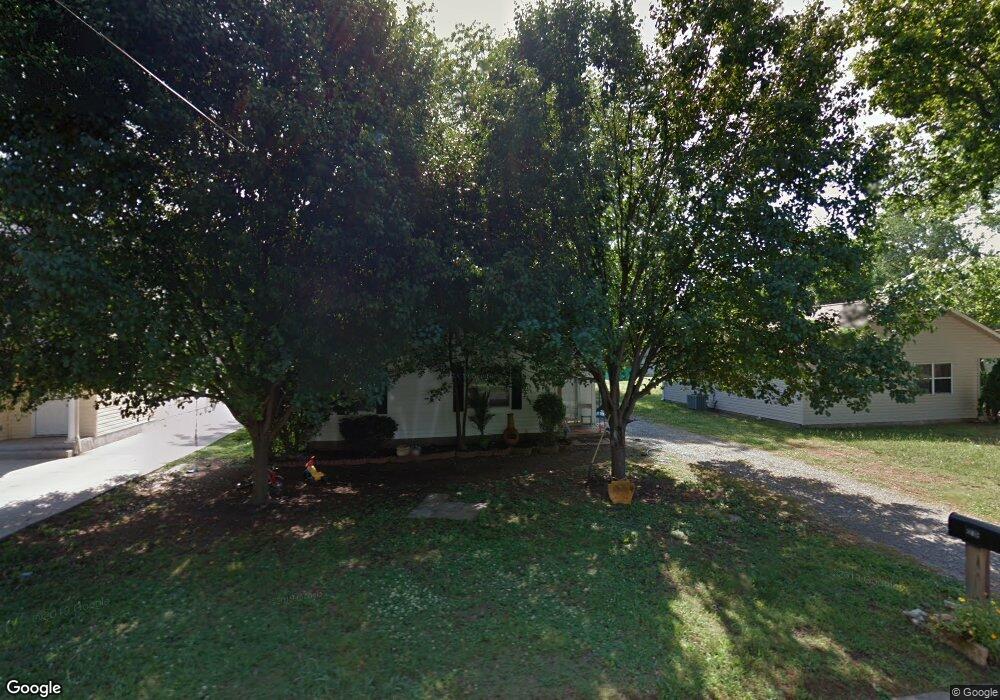
806 N Academy St Murfreesboro, TN 37130
Estimated Value: $221,000 - $284,189
--
Bed
2
Baths
1,059
Sq Ft
$251/Sq Ft
Est. Value
About This Home
This home is located at 806 N Academy St, Murfreesboro, TN 37130 and is currently estimated at $265,547, approximately $250 per square foot. 806 N Academy St is a home located in Rutherford County with nearby schools including Mitchell-Neilson Elementary, Siegel Middle School, and Siegel High School.
Ownership History
Date
Name
Owned For
Owner Type
Purchase Details
Closed on
Aug 29, 2005
Sold by
Craver Barton K
Bought by
Strickland Raymond C and Strickland Patrici
Current Estimated Value
Home Financials for this Owner
Home Financials are based on the most recent Mortgage that was taken out on this home.
Original Mortgage
$79,463
Interest Rate
5.71%
Purchase Details
Closed on
Mar 24, 2005
Sold by
Citifinancial
Bought by
Craver Barton K
Purchase Details
Closed on
Nov 5, 2004
Sold by
Joanne Arms Alicia
Bought by
Citifinancial
Purchase Details
Closed on
Nov 10, 1997
Sold by
Rutherford County Habitat
Bought by
Arms Alicia J
Home Financials for this Owner
Home Financials are based on the most recent Mortgage that was taken out on this home.
Original Mortgage
$51,244
Interest Rate
7.27%
Create a Home Valuation Report for This Property
The Home Valuation Report is an in-depth analysis detailing your home's value as well as a comparison with similar homes in the area
Home Values in the Area
Average Home Value in this Area
Purchase History
| Date | Buyer | Sale Price | Title Company |
|---|---|---|---|
| Strickland Raymond C | $88,500 | -- | |
| Craver Barton K | $65,500 | -- | |
| Citifinancial | $28,951 | -- | |
| Arms Alicia J | $55,000 | -- |
Source: Public Records
Mortgage History
| Date | Status | Borrower | Loan Amount |
|---|---|---|---|
| Closed | Arms Alicia J | $79,463 | |
| Previous Owner | Arms Alicia J | $51,244 |
Source: Public Records
Tax History Compared to Growth
Tax History
| Year | Tax Paid | Tax Assessment Tax Assessment Total Assessment is a certain percentage of the fair market value that is determined by local assessors to be the total taxable value of land and additions on the property. | Land | Improvement |
|---|---|---|---|---|
| 2025 | -- | $51,025 | $13,750 | $37,275 |
| 2024 | -- | $51,025 | $13,750 | $37,275 |
| 2023 | $957 | $51,025 | $13,750 | $37,275 |
| 2022 | $825 | $51,025 | $13,750 | $37,275 |
| 2021 | $695 | $31,325 | $8,125 | $23,200 |
| 2020 | $695 | $31,325 | $8,125 | $23,200 |
| 2019 | $695 | $31,325 | $8,125 | $23,200 |
| 2018 | $955 | $31,325 | $0 | $0 |
| 2017 | $783 | $20,150 | $0 | $0 |
| 2016 | $783 | $20,150 | $0 | $0 |
| 2015 | $783 | $20,150 | $0 | $0 |
| 2014 | $501 | $20,150 | $0 | $0 |
| 2013 | -- | $18,750 | $0 | $0 |
Source: Public Records
Map
Nearby Homes
- 804 N Academy St
- 814 N Church St
- 717 N Church St
- 428 Forrest St
- 446 Roberts St
- 904 N Maple St
- 725 N Highland Ave
- 906 N Maple St
- 422 N Academy St
- 412 N Church St
- 513 N Maple St
- 1019 N Maple St Unit 2D
- 225 N Academy St
- 418 Winfrey Dr
- 1007 Grantland Ave
- 1107 Owen Layne Dr
- 1116 Owen Layne Dr
- 730 E Burton St
- 608 Lynn St
- 301 Kingwood Dr
- 810A N Academy St
- 810 N Academy St
- 810 N Academy St Unit B
- 810 N Academy St Unit A
- 327 Evergreen St
- 814 N Academy St
- 802 N Academy St
- 715 Courtland St
- 719 Courtland St
- 711 Courtland St
- 711 Courtland Steet
- 818 N Academy St Unit A
- 321 Evergreen St
- 707 Courtland St
- 705 Courtland St
- 737 N Academy St
- 724 N Academy St
- 805 Courtland St
- 731 N Academy St