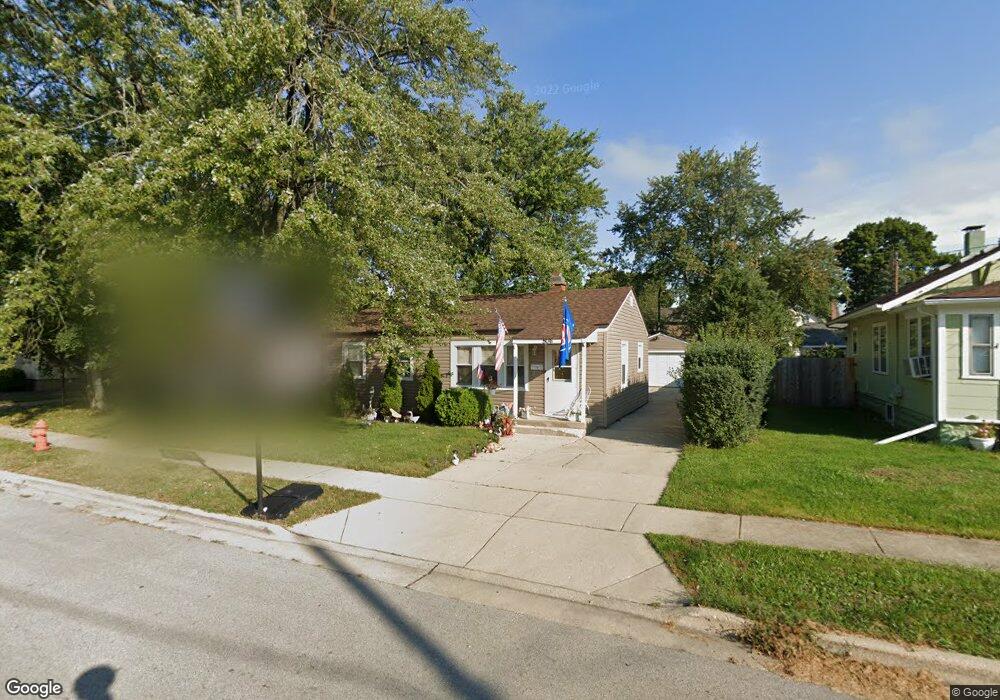
806 Parkway Ave Elgin, IL 60120
Cobblers Crossing NeighborhoodEstimated Value: $274,040 - $326,000
4
Beds
1
Bath
1,225
Sq Ft
$236/Sq Ft
Est. Value
About This Home
This home is located at 806 Parkway Ave, Elgin, IL 60120 and is currently estimated at $289,510, approximately $236 per square foot. 806 Parkway Ave is a home located in Cook County with nearby schools including Coleman Elementary School, Larsen Middle School, and Elgin High School.
Ownership History
Date
Name
Owned For
Owner Type
Purchase Details
Closed on
Dec 23, 2011
Sold by
Padron Jesse and Padron Christina
Bought by
Ramos Miguel A
Current Estimated Value
Home Financials for this Owner
Home Financials are based on the most recent Mortgage that was taken out on this home.
Original Mortgage
$100,388
Outstanding Balance
$69,945
Interest Rate
4.4%
Mortgage Type
FHA
Estimated Equity
$219,565
Purchase Details
Closed on
May 27, 2011
Sold by
Secretary Of Housing & Urban Development
Bought by
Padron Jesse
Purchase Details
Closed on
Mar 8, 2010
Sold by
Martinez
Bought by
The Secretary Of Housing & Urban Develop
Purchase Details
Closed on
Apr 30, 1999
Sold by
Powell Michael W and Powell Mary J
Bought by
Martinez Ismael and Martinez Rosa
Home Financials for this Owner
Home Financials are based on the most recent Mortgage that was taken out on this home.
Original Mortgage
$121,882
Interest Rate
6.92%
Mortgage Type
FHA
Create a Home Valuation Report for This Property
The Home Valuation Report is an in-depth analysis detailing your home's value as well as a comparison with similar homes in the area
Home Values in the Area
Average Home Value in this Area
Purchase History
| Date | Buyer | Sale Price | Title Company |
|---|---|---|---|
| Ramos Miguel A | $105,000 | First American Title | |
| Padron Jesse | -- | Stc | |
| The Secretary Of Housing & Urban Develop | -- | None Available | |
| Martinez Ismael | $123,000 | -- |
Source: Public Records
Mortgage History
| Date | Status | Borrower | Loan Amount |
|---|---|---|---|
| Open | Ramos Miguel A | $100,388 | |
| Previous Owner | Martinez Ismael | $121,882 |
Source: Public Records
Tax History Compared to Growth
Tax History
| Year | Tax Paid | Tax Assessment Tax Assessment Total Assessment is a certain percentage of the fair market value that is determined by local assessors to be the total taxable value of land and additions on the property. | Land | Improvement |
|---|---|---|---|---|
| 2024 | $5,181 | $18,000 | $2,760 | $15,240 |
| 2023 | $5,035 | $18,000 | $2,760 | $15,240 |
| 2022 | $5,035 | $18,000 | $2,760 | $15,240 |
| 2021 | $4,677 | $13,572 | $1,897 | $11,675 |
| 2020 | $4,647 | $13,572 | $1,897 | $11,675 |
| 2019 | $4,674 | $15,250 | $1,897 | $13,353 |
| 2018 | $4,226 | $12,437 | $1,725 | $10,712 |
| 2017 | $4,212 | $12,437 | $1,725 | $10,712 |
| 2016 | $3,963 | $12,437 | $1,725 | $10,712 |
| 2015 | $3,962 | $11,278 | $1,552 | $9,726 |
| 2014 | $3,838 | $11,278 | $1,552 | $9,726 |
| 2013 | $3,712 | $11,278 | $1,552 | $9,726 |
Source: Public Records
Map
Nearby Homes
- 796 Parkway Ave
- 1409 Dundee Ave
- 1152 Hiawatha Dr
- 1103 Hiawatha Dr
- Vacant Lot Parcel 1 Congdon Ave
- 904 Chippewa Dr
- 1212 Shawford Way Unit 17
- 1104 Loganbury Ct Unit 33211
- 72 Parkwood Rd Unit 464
- 1178 Country Club Rd
- 82 Northshore Rd Unit 491
- 698 Hiawatha Dr
- 624 Lincoln Ave
- 1167 Candida Rd Unit 532
- 1147 Candida Rd Unit 527
- 117 Parkwood Rd
- 114 Melbrooke Rd
- 930 Jefferson Ave
- 1080 Wakefield Dr
- 130 Parkwood Rd Unit 456
- 810 Parkway Ave
- 800 Parkway Ave
- 814 Parkway Ave
- 807 Stewart Ave
- 801 Stewart Ave
- 1250 Victor Ave
- 811 Stewart Ave
- 792 Parkway Ave
- 1280 Victor Ave
- 805 Parkway Ave
- 799 Parkway Ave
- 809 Parkway Ave
- 788 Parkway Ave
- 793 Parkway Ave
- 817 Parkway Ave
- 793 Stewart Ave
- 787 Stewart Ave
- 819 Parkway Ave
- 852 Parkway Ave
- 782 Parkway Ave