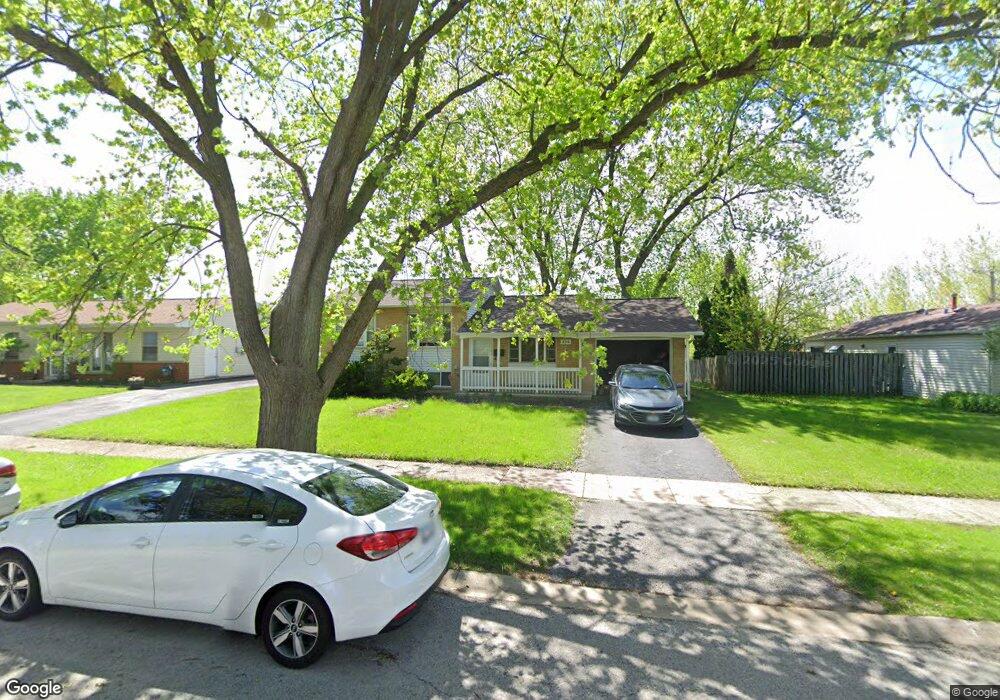
806 Princeton Ave Matteson, IL 60443
West Matteson NeighborhoodEstimated Value: $197,432 - $206,000
3
Beds
2
Baths
1,044
Sq Ft
$194/Sq Ft
Est. Value
About This Home
This home is located at 806 Princeton Ave, Matteson, IL 60443 and is currently estimated at $202,108, approximately $193 per square foot. 806 Princeton Ave is a home located in Cook County with nearby schools including Colin Powell Middle School and Southland College Prep.
Ownership History
Date
Name
Owned For
Owner Type
Purchase Details
Closed on
Apr 24, 2023
Sold by
Benson Althea
Bought by
Kos Karly
Current Estimated Value
Home Financials for this Owner
Home Financials are based on the most recent Mortgage that was taken out on this home.
Original Mortgage
$6,000
Interest Rate
6.6%
Purchase Details
Closed on
May 17, 2017
Sold by
Lcr Financial Llc
Bought by
Benson Aithea
Home Financials for this Owner
Home Financials are based on the most recent Mortgage that was taken out on this home.
Original Mortgage
$124,699
Interest Rate
4.03%
Mortgage Type
FHA
Purchase Details
Closed on
Oct 31, 2016
Sold by
Wells Fargo Bank Na
Bought by
Lcr Financial Llc
Purchase Details
Closed on
Jul 21, 2011
Sold by
Mulcahy Suzanne
Bought by
Minotti John
Home Financials for this Owner
Home Financials are based on the most recent Mortgage that was taken out on this home.
Original Mortgage
$90,642
Interest Rate
4.75%
Mortgage Type
FHA
Create a Home Valuation Report for This Property
The Home Valuation Report is an in-depth analysis detailing your home's value as well as a comparison with similar homes in the area
Home Values in the Area
Average Home Value in this Area
Purchase History
| Date | Buyer | Sale Price | Title Company |
|---|---|---|---|
| Kos Karly | $180,000 | Fidelity National Title | |
| Benson Aithea | -- | Fidelity National Title | |
| Lcr Financial Llc | $46,000 | Servicelink | |
| Minotti John | $93,000 | Attorneys Title Guaranty Fun |
Source: Public Records
Mortgage History
| Date | Status | Borrower | Loan Amount |
|---|---|---|---|
| Closed | Kos Karly | $6,000 | |
| Open | Kos Karly | $174,600 | |
| Previous Owner | Benson Aithea | $124,699 | |
| Previous Owner | Minotti John | $90,642 |
Source: Public Records
Tax History
| Year | Tax Paid | Tax Assessment Tax Assessment Total Assessment is a certain percentage of the fair market value that is determined by local assessors to be the total taxable value of land and additions on the property. | Land | Improvement |
|---|---|---|---|---|
| 2025 | $4,844 | $15,000 | $3,016 | $11,984 |
| 2024 | $4,844 | $15,000 | $3,016 | $11,984 |
| 2023 | $4,482 | $15,000 | $3,016 | $11,984 |
| 2022 | $4,482 | $11,791 | $2,639 | $9,152 |
| 2021 | $4,572 | $11,791 | $2,639 | $9,152 |
| 2020 | $4,537 | $11,791 | $2,639 | $9,152 |
| 2019 | $6,753 | $12,359 | $2,450 | $9,909 |
| 2018 | $6,654 | $12,359 | $2,450 | $9,909 |
| 2017 | $4,703 | $12,359 | $2,450 | $9,909 |
| 2016 | $4,195 | $10,603 | $2,262 | $8,341 |
| 2015 | $4,055 | $10,603 | $2,262 | $8,341 |
| 2014 | $3,972 | $10,603 | $2,262 | $8,341 |
| 2013 | $5,060 | $11,000 | $2,262 | $8,738 |
Source: Public Records
Map
Nearby Homes
- 829 Princeton Ave
- 5631 Colgate Ln
- 912 Princeton Ave
- 997 Regent Dr
- 1010 Regent Dr
- 5503 Georgetown Dr
- 763 Cambridge Ave
- 5327 Northwestern Dr
- 6021 Spring Ln
- 6037 Spring Ln
- 322 Central Ave
- 6125 Sunflower Dr
- 5620 Feathercreek Rd
- 5804 Kathryn Ln
- 6158 White Birch Ln
- 6216 Pond View Dr
- 5808 Allemong Dr
- 21131 Vivienne Dr
- 21156 Christina Dr
- 156 Cloverleaf Rd
- 812 Princeton Ave
- 5657 Colgate Ln
- 807 Princeton Ave
- 5645 Colgate Ln
- 813 Princeton Ave
- 824 Princeton Ave
- 817 Princeton Ave
- 830 Princeton Ave
- 823 Princeton Ave
- 806 Dartmouth Ave
- 812 Dartmouth Ave
- 818 Dartmouth Ave
- 835 Princeton Ave
- 842 Princeton Ave
- 830 Dartmouth Ave
- 5624 Colgate Ln
- 841 Princeton Ave
- 836 Dartmouth Ave
- 848 Princeton Ave
Your Personal Tour Guide
Ask me questions while you tour the home.