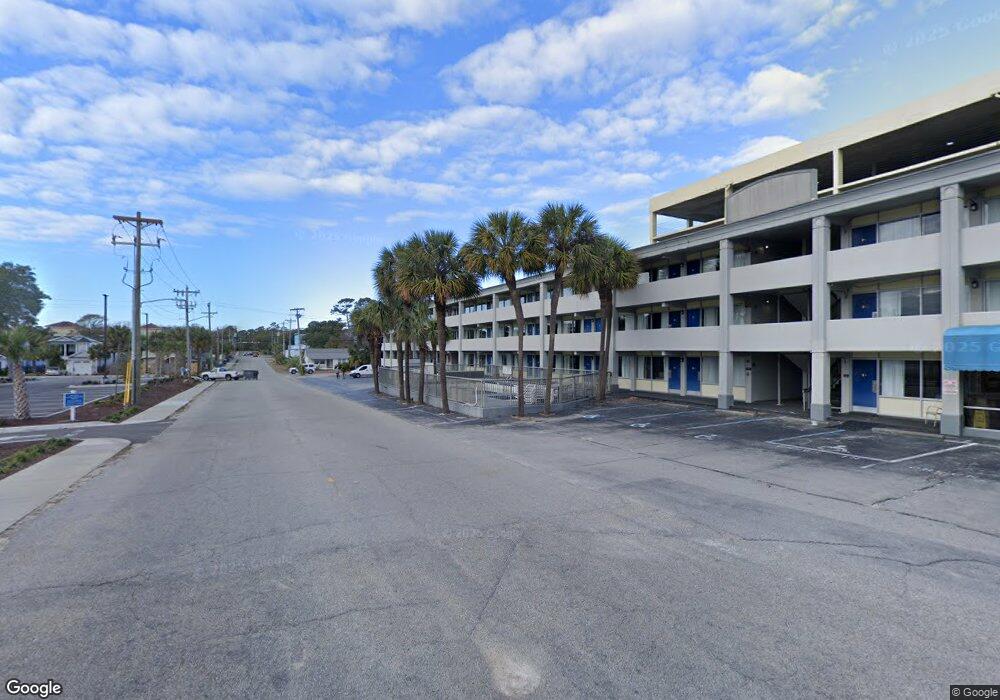
806 S Ocean Blvd Myrtle Beach, SC 29577
Downtown Myrtle Beach NeighborhoodEstimated Value: $3,995,892
--
Bed
--
Bath
24,530
Sq Ft
$163/Sq Ft
Est. Value
About This Home
This home is located at 806 S Ocean Blvd, Myrtle Beach, SC 29577 and is currently priced at $3,995,892, approximately $162 per square foot. 806 S Ocean Blvd is a home located in Horry County with nearby schools including Myrtle Beach Child Development Center, Myrtle Beach Primary School, and Myrtle Beach Elementary School.
Ownership History
Date
Name
Owned For
Owner Type
Purchase Details
Closed on
Oct 6, 2023
Sold by
Yk Grand Strand Llc
Bought by
Hayaty Llc
Current Estimated Value
Home Financials for this Owner
Home Financials are based on the most recent Mortgage that was taken out on this home.
Original Mortgage
$1,400,000
Interest Rate
7.12%
Mortgage Type
New Conventional
Purchase Details
Closed on
Oct 21, 2021
Sold by
Lkaps Holdings Llc
Bought by
Yk Grand Strand Llc
Home Financials for this Owner
Home Financials are based on the most recent Mortgage that was taken out on this home.
Original Mortgage
$2,531,250
Interest Rate
2.88%
Mortgage Type
New Conventional
Purchase Details
Closed on
May 8, 2017
Sold by
Tropical Resort Llc
Bought by
Lkaps Holdings Llc
Home Financials for this Owner
Home Financials are based on the most recent Mortgage that was taken out on this home.
Original Mortgage
$1,840,000
Interest Rate
4.1%
Mortgage Type
New Conventional
Create a Home Valuation Report for This Property
The Home Valuation Report is an in-depth analysis detailing your home's value as well as a comparison with similar homes in the area
Home Values in the Area
Average Home Value in this Area
Purchase History
| Date | Buyer | Sale Price | Title Company |
|---|---|---|---|
| Hayaty Llc | $3,725,000 | -- | |
| Yk Grand Strand Llc | $3,375,000 | -- | |
| Lkaps Holdings Llc | $2,125,000 | -- |
Source: Public Records
Mortgage History
| Date | Status | Borrower | Loan Amount |
|---|---|---|---|
| Closed | Hayaty Llc | $1,400,000 | |
| Previous Owner | Yk Grand Strand Llc | $2,531,250 | |
| Previous Owner | Lkaps Holdings Llc | $1,840,000 |
Source: Public Records
Tax History Compared to Growth
Tax History
| Year | Tax Paid | Tax Assessment Tax Assessment Total Assessment is a certain percentage of the fair market value that is determined by local assessors to be the total taxable value of land and additions on the property. | Land | Improvement |
|---|---|---|---|---|
| 2024 | $53,439 | $201,962 | $88,380 | $113,582 |
| 2023 | $0 | $117,459 | $49,131 | $68,328 |
| 2021 | $49,985 | $152,328 | $32,754 | $119,574 |
| 2020 | $30,269 | $152,328 | $32,754 | $119,574 |
| 2019 | $30,269 | $152,328 | $32,754 | $119,574 |
| 2018 | $0 | $155,106 | $34,965 | $120,141 |
| 2017 | $20,869 | $92,828 | $32,432 | $60,396 |
| 2016 | -- | $83,160 | $48,648 | $34,512 |
| 2015 | $20,631 | $83,160 | $48,648 | $34,512 |
| 2014 | $20,060 | $83,160 | $48,648 | $34,512 |
Source: Public Records
Map
Nearby Homes
- 704 S Ocean Blvd Unit 304
- 704 S Ocean Blvd Unit 101
- 406 9th Ave S Unit 9
- 706 Mitchell Dr
- 700 Mitchell Dr
- 1019 S Kings Hwy Unit 1019
- 601 Mitchell Dr Unit 207
- 601 Mitchell Dr Unit 407
- 601 Mitchell Dr Unit 801
- 601 Mitchell Dr Unit 206
- 601 Mitchell Dr Unit 1402
- 601 Mitchell Dr Unit 1202
- 601 Mitchell Dr Unit 1103
- 601 Mitchell Dr Unit 205
- 601 Mitchell Dr Unit 401
- 601 Mitchell Dr Unit 1401
- 601 Mitchell Dr Unit 203
- 601 Mitchell Dr Unit 603
- 1028 S Kings Hwy Unit 1028
- 1105 S Ocean Blvd Unit 1008
- 901 Yaupon Dr
- 901 Yaupon Dr Unit Lot 2
- 801 2001 S Ocean Blvd 801
- 812 Yaupon Dr Unit MB
- 810 Yaupon Dr
- 810 Yaupon Dr Unit MB
- 900 Yaupon Dr
- 800 Yaupon Dr
- 902 Yaupon Dr
- 902 Yaupon Dr Unit Lot 3
- 904 Yaupon Dr
- 906 Yaupon Dr
- 803 S Ocean Blvd Unit 803
- 803 S Ocean Blvd Unit 803
- 304 10th Ave S
- 704A S Ocean Blvd Unit 105-A Myrtle Beach V
- 704 S Ocean Blvd Unit 704 S Ocean Blvd A20
- 704 S Ocean Blvd Unit Myrtle Beach Villas
- 704 S Ocean Blvd
- 704 S Ocean Blvd Unit 205