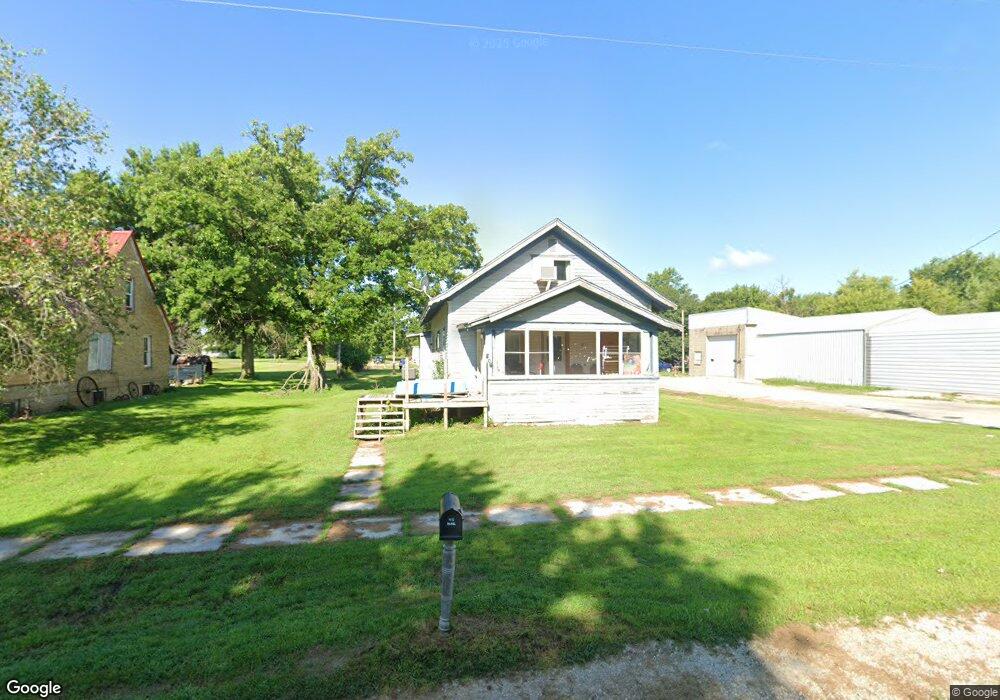
806 Station St Chelsea, IA 52215
Estimated Value: $41,000 - $73,667
2
Beds
2
Baths
1,413
Sq Ft
$38/Sq Ft
Est. Value
About This Home
This home is located at 806 Station St, Chelsea, IA 52215 and is currently estimated at $53,917, approximately $38 per square foot. 806 Station St is a home with nearby schools including South Tama County Elementary School, South Tama County Middle School, and South Tama County High School.
Ownership History
Date
Name
Owned For
Owner Type
Purchase Details
Closed on
Apr 23, 2021
Sold by
Fonseca Jose A and Fonseca Ramona
Bought by
Alvarez Raudel Alcaraz
Current Estimated Value
Purchase Details
Closed on
Jul 9, 2012
Sold by
Beck Jon R and Beck Wendi L
Bought by
Fonseca Jose A and Fonseca Ramona
Home Financials for this Owner
Home Financials are based on the most recent Mortgage that was taken out on this home.
Original Mortgage
$25,000
Interest Rate
3.64%
Mortgage Type
New Conventional
Create a Home Valuation Report for This Property
The Home Valuation Report is an in-depth analysis detailing your home's value as well as a comparison with similar homes in the area
Home Values in the Area
Average Home Value in this Area
Purchase History
| Date | Buyer | Sale Price | Title Company |
|---|---|---|---|
| Alvarez Raudel Alcaraz | $25,000 | None Available | |
| Fonseca Jose A | $25,000 | None Available |
Source: Public Records
Mortgage History
| Date | Status | Borrower | Loan Amount |
|---|---|---|---|
| Previous Owner | Fonseca Jose A | $25,000 |
Source: Public Records
Tax History Compared to Growth
Tax History
| Year | Tax Paid | Tax Assessment Tax Assessment Total Assessment is a certain percentage of the fair market value that is determined by local assessors to be the total taxable value of land and additions on the property. | Land | Improvement |
|---|---|---|---|---|
| 2024 | $494 | $24,290 | $3,750 | $20,540 |
| 2023 | $474 | $24,290 | $3,750 | $20,540 |
| 2022 | $360 | $21,520 | $3,750 | $17,770 |
| 2021 | $376 | $16,940 | $3,750 | $13,190 |
| 2020 | $6 | $17,060 | $3,750 | $13,310 |
| 2019 | $580 | $27,200 | $0 | $0 |
| 2018 | $630 | $27,200 | $0 | $0 |
| 2017 | $630 | $27,200 | $0 | $0 |
| 2016 | $604 | $27,200 | $3,750 | $23,450 |
| 2015 | $590 | $27,200 | $3,750 | $23,450 |
| 2014 | $590 | $26,310 | $3,750 | $22,560 |
Source: Public Records
Map
Nearby Homes