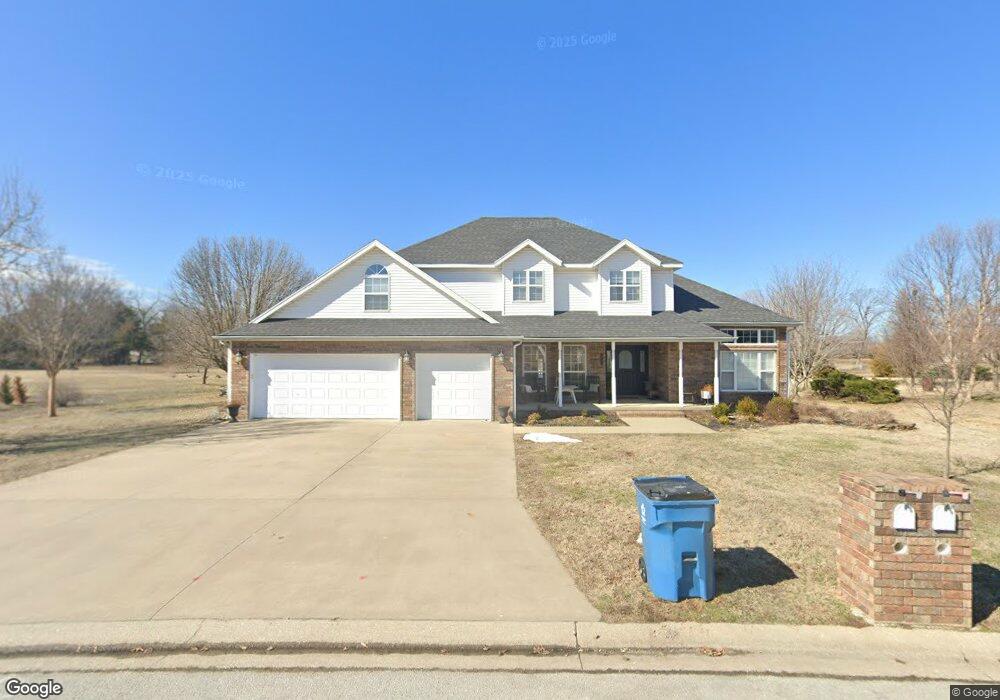
806 W Briarbrook Ln Unit A & B Carl Junction, MO 64834
Briarbrook NeighborhoodEstimated Value: $347,114 - $415,000
3
Beds
2
Baths
1,420
Sq Ft
$271/Sq Ft
Est. Value
About This Home
This home is located at 806 W Briarbrook Ln Unit A & B, Carl Junction, MO 64834 and is currently estimated at $385,279, approximately $271 per square foot. 806 W Briarbrook Ln Unit A & B is a home located in Jasper County with nearby schools including Carl Junction Primary School (K-1), Carl Junction Intermediate School, and Carl Junction Primary School (2-3).
Ownership History
Date
Name
Owned For
Owner Type
Purchase Details
Closed on
Feb 9, 2009
Sold by
Thomas Investments Llc
Bought by
Yantis Craig and Yantis Tanya
Current Estimated Value
Home Financials for this Owner
Home Financials are based on the most recent Mortgage that was taken out on this home.
Original Mortgage
$181,662
Outstanding Balance
$112,579
Interest Rate
5.06%
Mortgage Type
Purchase Money Mortgage
Estimated Equity
$272,700
Purchase Details
Closed on
Sep 11, 2008
Sold by
Bankliberty
Bought by
Thomas Investments Llc
Purchase Details
Closed on
Sep 2, 2008
Sold by
Porter Jason and Porter Amber
Bought by
Bankliberty
Purchase Details
Closed on
Mar 26, 2004
Sold by
Rowan Mark D and Rowan Julia A
Bought by
Porter Jason L and Porter Amber
Home Financials for this Owner
Home Financials are based on the most recent Mortgage that was taken out on this home.
Original Mortgage
$163,000
Interest Rate
5%
Mortgage Type
Purchase Money Mortgage
Create a Home Valuation Report for This Property
The Home Valuation Report is an in-depth analysis detailing your home's value as well as a comparison with similar homes in the area
Home Values in the Area
Average Home Value in this Area
Purchase History
| Date | Buyer | Sale Price | Title Company |
|---|---|---|---|
| Yantis Craig | -- | Fatco | |
| Thomas Investments Llc | -- | Abbey | |
| Bankliberty | $155,000 | None Available | |
| Porter Jason L | -- | -- |
Source: Public Records
Mortgage History
| Date | Status | Borrower | Loan Amount |
|---|---|---|---|
| Open | Yantis Craig | $181,662 | |
| Previous Owner | Porter Jason L | $163,000 |
Source: Public Records
Tax History
| Year | Tax Paid | Tax Assessment Tax Assessment Total Assessment is a certain percentage of the fair market value that is determined by local assessors to be the total taxable value of land and additions on the property. | Land | Improvement |
|---|---|---|---|---|
| 2025 | $2,295 | $39,880 | $4,670 | $35,210 |
| 2024 | $2,302 | $36,190 | $4,670 | $31,520 |
| 2023 | $2,302 | $36,190 | $4,670 | $31,520 |
| 2022 | $2,379 | $37,390 | $4,670 | $32,720 |
| 2021 | $2,059 | $37,390 | $4,670 | $32,720 |
| 2020 | $1,930 | $34,580 | $4,670 | $29,910 |
| 2019 | $1,836 | $34,580 | $4,670 | $29,910 |
| 2018 | $1,920 | $36,390 | $0 | $0 |
| 2017 | $1,924 | $36,390 | $0 | $0 |
| 2016 | $1,948 | $37,150 | $0 | $0 |
Source: Public Records
Map
Nearby Homes
- 106 Victoria Ln
- 501 Anita Dr
- 1021 Copper Oaks Dr
- 807 Copper Oaks Dr
- 907 Silver Oaks Dr
- 232 Hickory Place
- 909 Silver Oaks Dr
- 910 Silver Oaks
- 901 Black Thorn Dr
- 5854 County Rd 263
- 710 Briarbrook Dr
- XXX Lone Elm
- 708 Danica Jo Ln
- 126 N Windwood
- 6548 Mo-171
- LOT 4C Hwy 171 & Fir Rd Unit 4C
- 908 Silver Oaks Dr
- 328 Briarbrook Dr
- Lot 1B Hwy 171 & Fir Rd
- Lot 1A Hwy 171 & Fir Rd
- 806 W Briarbrook Ln
- 806 W Briarbrook Ln
- 802 W Briarbrook Ln
- 807 W Briarbrook Ln
- 810 W Briarbrook Ln
- 809 W Briarbrook Ln
- 803 W Briarbrook Ln
- 714 Springhill Dr
- 814 W Briarbrook Ln
- 1006 Briarbrook Dr
- 801 W Briarbrook Ln
- 801 Briarbrook Dr
- 813 W Briarbrook Ln
- 712 Springhill Dr
- 1004 Briarbrook Dr
- 710 W Briarbrook Ln
- 1002 Briarbrook Dr
- 1002 Briarbrook Dr Unit 1
- 815 W Briarbrook Ln
- 904 W Briarbrook Ln
Your Personal Tour Guide
Ask me questions while you tour the home.