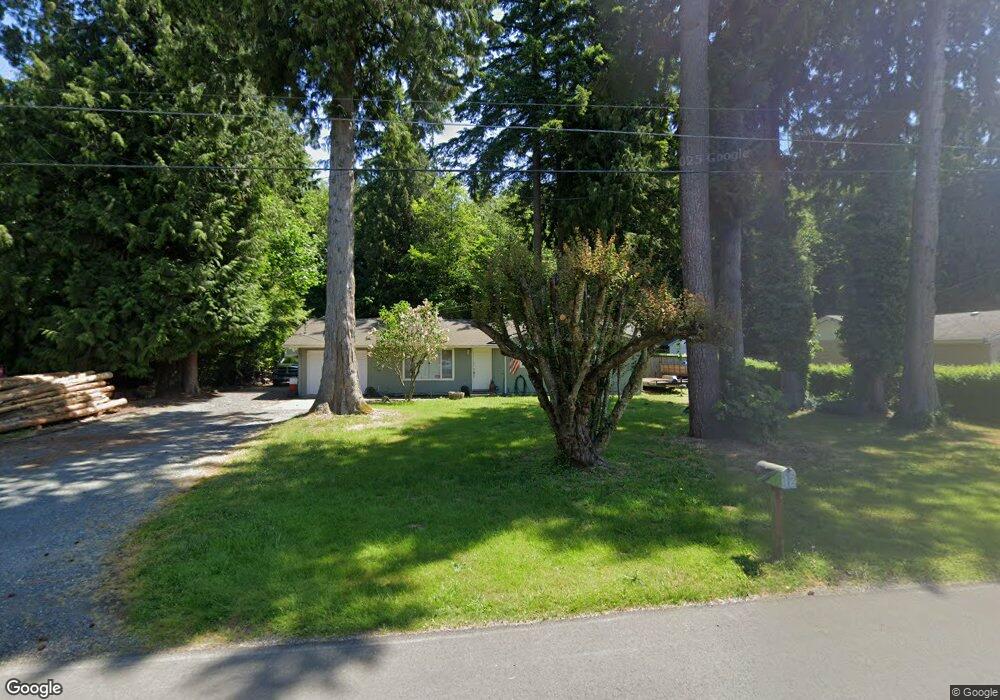
8060 Dean Dr Custer, WA 98240
Estimated Value: $429,000 - $577,000
3
Beds
1
Bath
990
Sq Ft
$477/Sq Ft
Est. Value
About This Home
This home is located at 8060 Dean Dr, Custer, WA 98240 and is currently estimated at $472,047, approximately $476 per square foot. 8060 Dean Dr is a home located in Whatcom County with nearby schools including Custer Elementary School, Horizon Middle School, and Ferndale High School.
Ownership History
Date
Name
Owned For
Owner Type
Purchase Details
Closed on
Apr 26, 2010
Sold by
Collecchi Monica J and Holman Monica J
Bought by
Smart Delbert G
Current Estimated Value
Home Financials for this Owner
Home Financials are based on the most recent Mortgage that was taken out on this home.
Original Mortgage
$162,011
Outstanding Balance
$107,977
Interest Rate
5.25%
Mortgage Type
FHA
Estimated Equity
$364,070
Purchase Details
Closed on
Jul 29, 2005
Sold by
Sperry Helen E
Bought by
Holman Monica J
Home Financials for this Owner
Home Financials are based on the most recent Mortgage that was taken out on this home.
Original Mortgage
$104,000
Interest Rate
5.56%
Mortgage Type
Purchase Money Mortgage
Create a Home Valuation Report for This Property
The Home Valuation Report is an in-depth analysis detailing your home's value as well as a comparison with similar homes in the area
Purchase History
| Date | Buyer | Sale Price | Title Company |
|---|---|---|---|
| Smart Delbert G | $165,280 | Chicago Title Insurance | |
| Holman Monica J | $130,280 | Chicago Title Insurance |
Source: Public Records
Mortgage History
| Date | Status | Borrower | Loan Amount |
|---|---|---|---|
| Open | Smart Delbert G | $162,011 | |
| Previous Owner | Holman Monica J | $104,000 |
Source: Public Records
Tax History
| Year | Tax Paid | Tax Assessment Tax Assessment Total Assessment is a certain percentage of the fair market value that is determined by local assessors to be the total taxable value of land and additions on the property. | Land | Improvement |
|---|---|---|---|---|
| 2025 | $3,203 | $424,756 | $223,100 | $201,656 |
| 2024 | $3,110 | $404,836 | $220,675 | $184,161 |
| 2023 | $3,110 | $427,078 | $250,000 | $177,078 |
| 2022 | $2,491 | $328,697 | $149,808 | $178,889 |
| 2021 | $2,538 | $271,650 | $123,808 | $147,842 |
| 2020 | $2,450 | $251,534 | $114,640 | $136,894 |
| 2019 | $1,971 | $219,079 | $99,848 | $119,231 |
| 2018 | $2,257 | $200,297 | $91,288 | $109,009 |
| 2017 | $1,908 | $175,530 | $80,000 | $95,530 |
| 2016 | $1,793 | $156,533 | $71,656 | $84,877 |
| 2015 | $1,804 | $147,496 | $67,841 | $79,655 |
| 2014 | -- | $144,395 | $66,300 | $78,095 |
| 2013 | -- | $142,245 | $65,000 | $77,245 |
Source: Public Records
Map
Nearby Homes
- 8085 Audra Ln
- 0 Willeys Lake Rd Unit NWM2442375
- 2948 Arnie Rd
- 8741 Delta Line Rd
- 0 Portal Way
- 1684 Brookwood Dr
- 0 Bay Rd Unit NWM2489001
- 0 2151xx Harksell Rd
- 8731 Valley View Rd
- 0 Sunrise Rd Unit NWM2483531
- 0 Sunrise Rd Unit NWM2483639
- 3151 Velvet Ln
- 0 Valley View Lot 2 Rd Unit NWM2208210
- 2020 Grandview Rd
- 3179 Velvet Ln
- 8306 Portal Way
- 2036 Grandview Rd
- 6850 Portal Way
- 0 Grandview Rd Unit NWM2386341
- 1939 Grandview Rd
Your Personal Tour Guide
Ask me questions while you tour the home.