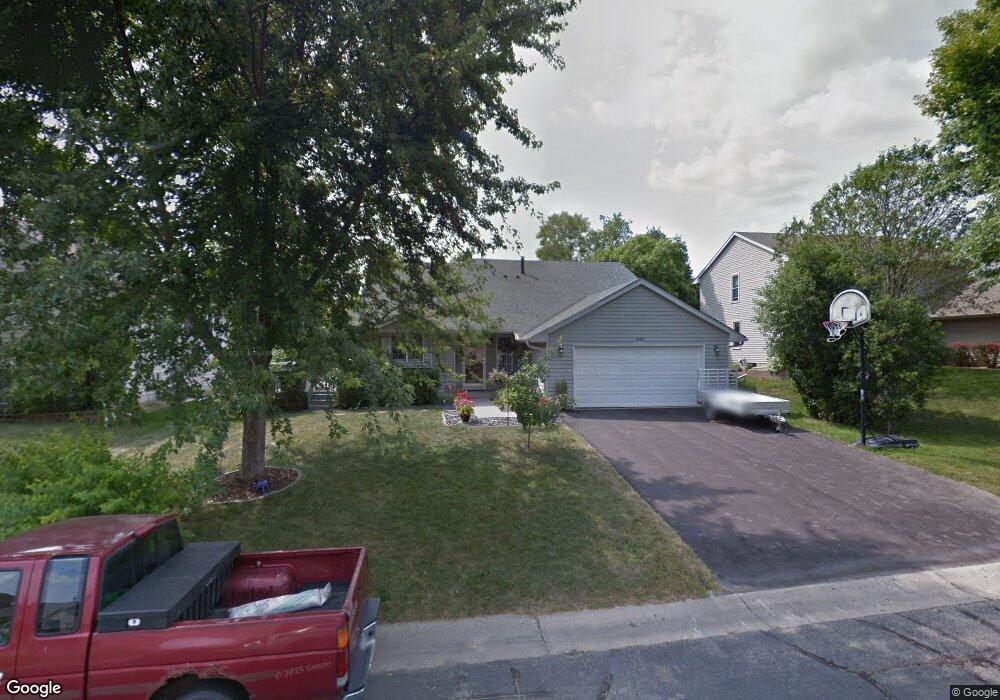
8060 Hidden Ct Chanhassen, MN 55317
Estimated Value: $439,000 - $524,000
4
Beds
3
Baths
1,530
Sq Ft
$310/Sq Ft
Est. Value
About This Home
This home is located at 8060 Hidden Ct, Chanhassen, MN 55317 and is currently estimated at $474,748, approximately $310 per square foot. 8060 Hidden Ct is a home located in Carver County with nearby schools including Chanhassen Elementary School, Pioneer Ridge Middle School, and Chanhassen High School.
Ownership History
Date
Name
Owned For
Owner Type
Purchase Details
Closed on
May 29, 2018
Sold by
Reddig Brad J and Reddig Sheryl E
Bought by
Wahl Brian K and Wahl Amber
Current Estimated Value
Home Financials for this Owner
Home Financials are based on the most recent Mortgage that was taken out on this home.
Original Mortgage
$339,625
Outstanding Balance
$293,055
Interest Rate
4.4%
Mortgage Type
New Conventional
Estimated Equity
$181,693
Purchase Details
Closed on
Oct 29, 2015
Sold by
Becker Kevin R and Becker Donna J
Bought by
Reddig Brad J and Reddig Sheryl E
Home Financials for this Owner
Home Financials are based on the most recent Mortgage that was taken out on this home.
Original Mortgage
$284,905
Interest Rate
3.87%
Mortgage Type
New Conventional
Purchase Details
Closed on
Sep 4, 1998
Sold by
Collins Michael H and Collins Rhonda W
Bought by
Becker Kevin R and Becker Donna J
Create a Home Valuation Report for This Property
The Home Valuation Report is an in-depth analysis detailing your home's value as well as a comparison with similar homes in the area
Home Values in the Area
Average Home Value in this Area
Purchase History
| Date | Buyer | Sale Price | Title Company |
|---|---|---|---|
| Wahl Brian K | $357,500 | Tredmark Title Services Inc | |
| Reddig Brad J | $299,900 | Trademark Title Services Inc | |
| Becker Kevin R | $185,000 | -- |
Source: Public Records
Mortgage History
| Date | Status | Borrower | Loan Amount |
|---|---|---|---|
| Open | Wahl Brian K | $339,625 | |
| Previous Owner | Reddig Brad J | $284,905 |
Source: Public Records
Tax History
| Year | Tax Paid | Tax Assessment Tax Assessment Total Assessment is a certain percentage of the fair market value that is determined by local assessors to be the total taxable value of land and additions on the property. | Land | Improvement |
|---|---|---|---|---|
| 2025 | $4,844 | $471,900 | $142,500 | $329,400 |
| 2024 | $4,854 | $441,900 | $133,000 | $308,900 |
| 2023 | $4,794 | $439,100 | $133,000 | $306,100 |
| 2022 | $4,510 | $436,000 | $130,000 | $306,000 |
| 2021 | $3,894 | $346,600 | $108,400 | $238,200 |
| 2020 | $3,992 | $346,600 | $108,400 | $238,200 |
| 2019 | $3,868 | $322,900 | $103,200 | $219,700 |
| 2018 | $3,528 | $322,900 | $103,200 | $219,700 |
| 2017 | $3,452 | $289,300 | $93,900 | $195,400 |
| 2016 | $3,706 | $268,800 | $0 | $0 |
| 2015 | $3,402 | $271,000 | $0 | $0 |
| 2014 | $3,402 | $229,300 | $0 | $0 |
Source: Public Records
Map
Nearby Homes
- 8046 Erie Spur
- 8136 Dakota Ln
- 7602 Erie Ave
- 5523 Game Farm Lookout
- 19073 Twilight Trail
- 18643 Magenta Bay
- 18566 Magenta Bay
- 18426 Magenta Bay
- 420 Monk Ct
- 18305 Dove Ct
- 7495 Saratoga Dr
- 7671 Nicholas Way
- 468 Heartland Ct
- 8789 N Bay Dr
- 7641 Nicholas Way
- 7623 Nicholas Way
- 7627 Nicholas Way
- 18341 Coneflower Ln
- 7717 Nicholas Way
- 8728 N Bay Dr
Your Personal Tour Guide
Ask me questions while you tour the home.