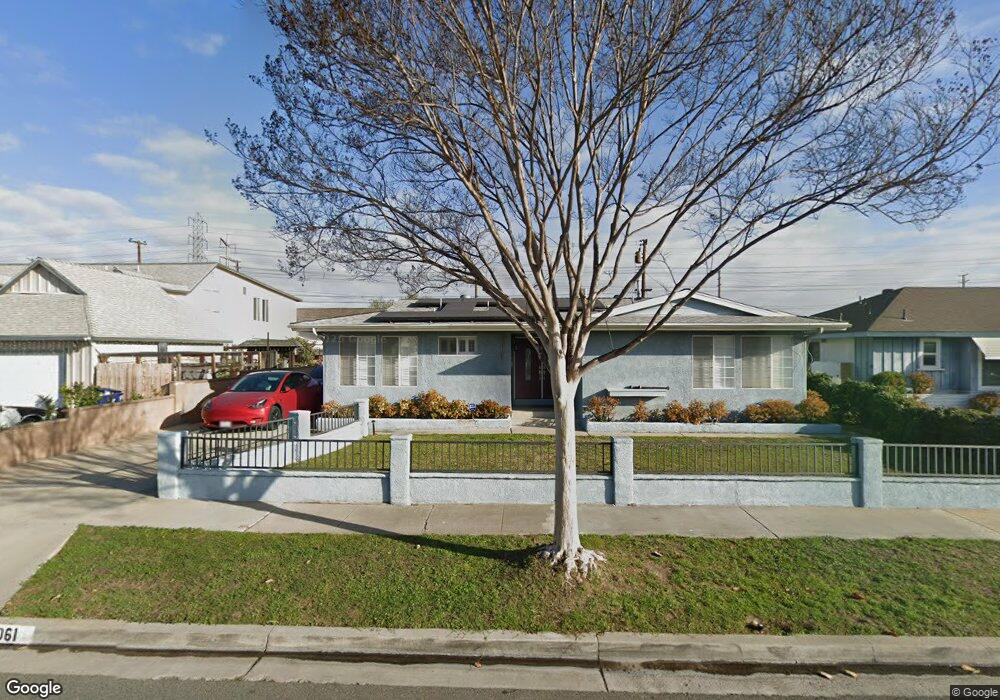
8061 Canna Cir Buena Park, CA 90620
Estimated Value: $929,000 - $991,000
3
Beds
2
Baths
1,787
Sq Ft
$539/Sq Ft
Est. Value
About This Home
This home is located at 8061 Canna Cir, Buena Park, CA 90620 and is currently estimated at $963,914, approximately $539 per square foot. 8061 Canna Cir is a home located in Orange County with nearby schools including Glen H. Dysinger Sr. Elementary School, Brookhurst Junior High School, and Savanna High School.
Ownership History
Date
Name
Owned For
Owner Type
Purchase Details
Closed on
Mar 28, 2022
Sold by
Sabater Catherine F
Bought by
Sabater Catherine F and Sabater Nelson G
Current Estimated Value
Home Financials for this Owner
Home Financials are based on the most recent Mortgage that was taken out on this home.
Original Mortgage
$651,200
Outstanding Balance
$612,769
Interest Rate
4.42%
Mortgage Type
FHA
Estimated Equity
$351,145
Purchase Details
Closed on
Mar 1, 2006
Sold by
Sabater Nelson
Bought by
Sabater Catherine F
Home Financials for this Owner
Home Financials are based on the most recent Mortgage that was taken out on this home.
Original Mortgage
$484,000
Interest Rate
6.08%
Mortgage Type
Purchase Money Mortgage
Purchase Details
Closed on
Feb 3, 2006
Sold by
Moore Darrell L and Moore Donna C
Bought by
Sabater Catherine F
Home Financials for this Owner
Home Financials are based on the most recent Mortgage that was taken out on this home.
Original Mortgage
$484,000
Interest Rate
6.08%
Mortgage Type
Purchase Money Mortgage
Create a Home Valuation Report for This Property
The Home Valuation Report is an in-depth analysis detailing your home's value as well as a comparison with similar homes in the area
Home Values in the Area
Average Home Value in this Area
Purchase History
| Date | Buyer | Sale Price | Title Company |
|---|---|---|---|
| Sabater Catherine F | -- | Stewart Title | |
| Sabater Catherine F | -- | Chicago Title Co | |
| Sabater Catherine F | $605,000 | Chicago Title Co |
Source: Public Records
Mortgage History
| Date | Status | Borrower | Loan Amount |
|---|---|---|---|
| Open | Sabater Catherine F | $651,200 | |
| Previous Owner | Sabater Catherine F | $484,000 |
Source: Public Records
Tax History Compared to Growth
Tax History
| Year | Tax Paid | Tax Assessment Tax Assessment Total Assessment is a certain percentage of the fair market value that is determined by local assessors to be the total taxable value of land and additions on the property. | Land | Improvement |
|---|---|---|---|---|
| 2025 | $9,436 | $833,485 | $716,993 | $116,492 |
| 2024 | $9,436 | $817,143 | $702,935 | $114,208 |
| 2023 | $8,897 | $773,017 | $681,623 | $91,394 |
| 2022 | $8,791 | $757,860 | $668,258 | $89,602 |
| 2021 | $18,156 | $743,000 | $655,154 | $87,846 |
| 2020 | $16,633 | $604,000 | $516,154 | $87,846 |
| 2019 | $16,583 | $604,000 | $516,154 | $87,846 |
| 2018 | $16,587 | $604,000 | $516,154 | $87,846 |
| 2017 | $6,330 | $543,000 | $461,051 | $81,949 |
| 2016 | $5,964 | $510,000 | $428,051 | $81,949 |
| 2015 | $5,392 | $456,508 | $374,559 | $81,949 |
| 2014 | $5,215 | $456,508 | $374,559 | $81,949 |
Source: Public Records
Map
Nearby Homes
- 21 Centerstone Cir
- 8194 Calendula Dr
- 8434 Periwinkle Dr
- 7575 El Escorial Way
- 7085 Oregon St
- 7122 Stanton Ave
- 7570 El Chaco Dr
- 7600 Western Ave
- 8054 Teakwood Cir
- 7911 Orangethorpe Ave
- 7430 El Rosal Cir
- 7451 Western Ave
- 2697 W Parkside Ln
- 8452 Stanton Ave
- 8319 Hickory Dr
- 7791 Melrose St
- 7579 Melrose St
- 8178 Santa Inez Dr
- 8214 Santa Inez Way
- 4231 W Hill Ave
- 8049 Canna Cir
- 8073 Canna Cir
- 8062 Callalily Cir
- 8050 Callalily Cir
- 8074 Callalily Cir
- 8037 Canna Cir
- 8038 Callalily Cir
- 8050 Canna Cir
- 8074 Canna Cir
- 8025 Canna Cir
- 8038 Canna Cir
- 8026 Callalily Cir
- 8026 Canna Cir
- 8061 Columbine Cir
- 8061 Callalily Cir
- 8073 Columbine Cir
- 8049 Columbine Cir
- 8049 Callalily Cir
- 8073 Callalily Cir
- 8013 Canna Cir